GPUSmith Article
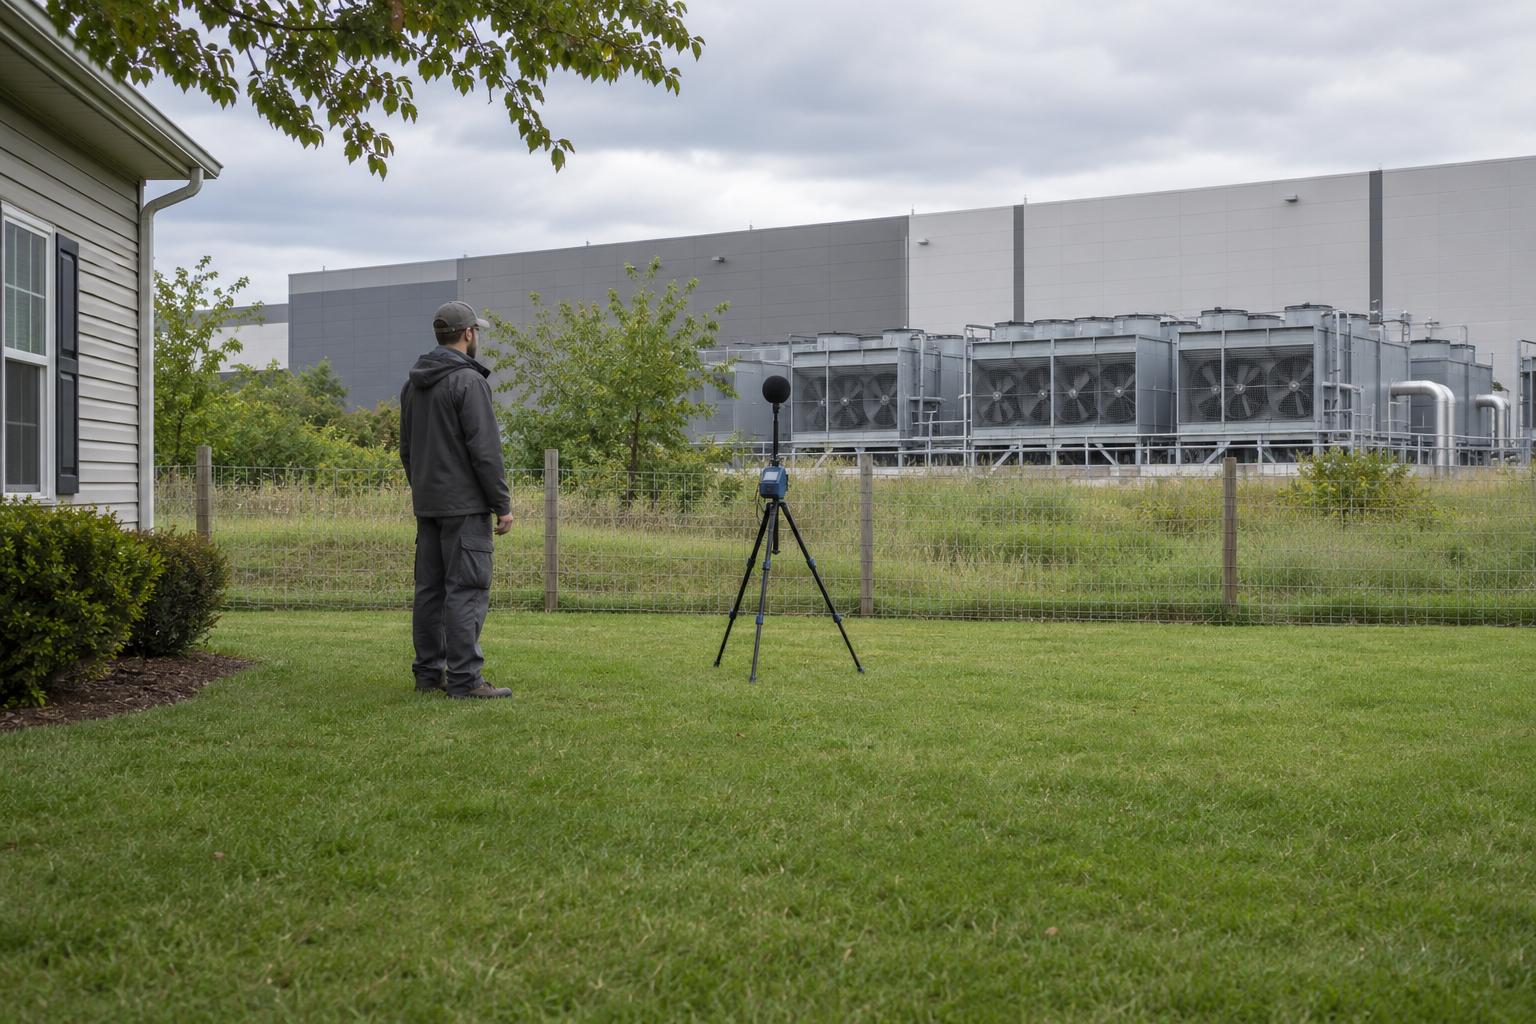
AI Data Center Noise: Acoustic Testing at the Property Line
2026 engineering reference for AI data center noise acoustic testing at the property line: sound power vs pressure, tonal evidence, Virginia example, and an equipment-to-receptor acceptance matrix.
Summary
- 01Every acoustic number needs a weighting, metric, averaging period, spectrum, distance and position, and operating state. A bare decibel value is insufficient evidence for acceptance.
- 02Sound power, near-source sound pressure and receptor measurements describe different quantities or locations. Equipment ratings cannot become property-line exposure claims without a propagation study.
- 03Contractual limits, planning conditions and health guidance serve different decisions. Acceptance specifications must identify the controlling authority, dated text, receptor and measurement method.
- 04A-weighted compliance alone can miss tonal and low-frequency content. Add C-weighted levels, third-octave spectra and narrowband analysis where that content is plausible.
- 05Models inform design and permitting; field measurements accept the installation. Equipment substitutions, fan firmware, enclosures, power plant changes and cooling capacity changes can reopen acceptance.
- 06The cited 96 dBA figure describes internal noise, not a property-line level or a clinical outcome. A source-to-claim ledger preserves the location and permitted use of each value.
Inside this article
- 01Executive Summary
- 02Introduction and Background
- 03Key Changes in How Acoustic Evidence Is Defined
- 04Implementation Considerations and Process Changes
- 05Data Analysis and Evidence
- 06Citation Audit: Following the 96 dBA Reference to Its Boundary
- 07Case Studies and Real-World Examples
- 08Implications and Future Directions
- 09Frequently Asked Questions (FAQs)
- 10Conclusion
Executive Summary
Property-line acoustic evidence for an AI data center is only as strong as the labels attached to each number. This report treats acoustic acceptance as a traceability problem: every equipment submittal and operating state should map to a modeled receptor condition and, after construction, to a measured one. As of November 2026, no single universal decibel table exists for this decision, and none is proposed here. The report is an evidence specification for the project's acoustician and permitting authority, not an acoustic design or a legal opinion.
The quantity labels matter first. A manufacturer's sound power level describes the source and is independent of the room, while sound pressure depends on distance and surroundings [1]. Generator data are commonly reported at 7 m [2], a chiller datasheet may report 1 m [3], and an October 2026 review says near-source readings "characterize individual equipment items, not community exposure" [4].
Regulatory text is jurisdiction specific. Loudoun County, Virginia, requires a pre-construction study at site plan review [5], measures at the receiving lot line at 5 feet above grade [6], and says it has no policy language specific to tonal noise [5]. Virginia Code 15.2-2209.5 reaches facilities requiring 100 megawatts or more [7] and asks for a sound profile on homes and schools within 500 feet [7] without naming a metric.
Modeling and measurement are different evidence classes. ISO 9613-2 predicts levels for propagation favorable to sound transmission ([8]), and the 1996 edition warned that daily variation at one site is expected to be considerably larger than its stated accuracy ([9]). Tonal and low-frequency content needs spectra, since A-weighting discounts 63 Hz by 26 dB ([10]).
The citation audit is a worked example. The 96 dBA figure originates in a perspective that scopes it to "internal noise levels" ([11]). It is not a property-line level, a universal operating level or evidence of a clinical outcome. An evidence ledger that records location, weighting and source hop for every value keeps an indoor number from becoming a neighbor-exposure claim. Four artifacts follow: an equipment and state register, a receptor matrix, a source-to-claim ledger and a study-to-as-built change register. Absent values stay marked unknown.
Introduction and Background
Owners of private GPU facilities, colocation selection teams, commissioning engineers and technical investors face a recurring procurement question: does a proposed site, with its proposed cooling and backup-power equipment, have adequate acoustic evidence to buy against and later accept? Public discussion has grown quickly. An Environmental and Energy Study Institute (EESI) explainer lists cooling systems, air chillers, diesel generators and fans as the sources of data center sound ([12]), and says most local ordinances were written for other sources ([12]). A technical article cannot settle local law, but it can specify what evidence should exist before money is committed.
This report is written by GPU Smith, an AI infrastructure engineering consultancy. It is not a seller of cooling plant, generators or acoustic services, and it has no site measurements, acoustic simulations or new benchmarks behind it. Everything quantitative below is traced to a regulator, standards body, peer-reviewed or preprint source, or a manufacturer's own document for that manufacturer's own claims, and vendor figures are labeled as vendor claims. The report does not substitute for the project acoustician, a licensed engineer where the jurisdiction requires one, or legal counsel.
Three distinctions frame everything that follows.
- Contractual limits are what the owner and the supplier or tenant agree to, for example a sound power guarantee or an acceptance threshold in a purchase specification.
- Planning conditions and ordinances are what an authority imposes. ISO 1996-1 itself is explicit that it "does not specify limits for environmental noise" ([13]).
- Health guidance is advisory. The World Health Organization (WHO) says its 2018 European guidelines "set health-based recommendations on average exposure" (Source: who.int)), which is not a short-term property-line compliance test.
The jurisdiction example is Virginia, because its 2026 statute and Loudoun County's guidance are recent and public. The effective law for any specific project must be re-verified at the time of use, and the global engineering principles apply regardless of location.
Key Changes in How Acoustic Evidence Is Defined
Change 1: Every number carries a quantity label
The first change is cultural: a bare "dB" is no longer an acceptable submittal. Sound power level (Lw) is a property of the source, referenced to 1 picowatt [14]. Sound pressure level (Lp) depends on where it is measured. Rehlko, a generator manufacturer, states that sound power "is a calculated measure" [15] and that free-field pressure falls 6 dB per doubling of distance [15]. A generator maker also warns that "No manufacturer can predict or publish a guaranteed on-site" level [2], because site reflections and ambient sound enter the reading.
Every value in a submittal or study should therefore name six things:
- Weighting: A, C or unweighted.
- Metric: for example LAeq or L90.
- Averaging period: the interval over which the level is defined.
- Spectrum: octave, third-octave or narrowband.
- Distance and position: relative to the source, with the surfaces nearby.
- Operating state: load, speed, mode and equipment quantity.
Averaging itself is not trivial. Caterpillar's worked example shows a logarithmic mean of 93.0 dBA across measurement positions where an arithmetic mean would wrongly give 90.5 ([16]).
Combining sources follows the energy rule, not ordinary addition. The Federal Highway Administration (FHWA) states that two equal sources are 3 dB louder than one [17] and that "two trucks producing 90 dB each will combine to produce 93 dB, not 180 dB" [17]. The relation is L_total = 10 log10( sum of 10^(L_i/10) ), valid only for independent sources whose levels share a reference, weighting and averaging basis. Doubling the number of identical units adds about 3 dB at a given point under those assumptions; it does not mean a larger facility adds 3 dB at every neighbor, because distances, screening and tonal content differ per path. Time averaging follows the same logic: the equivalent level is the steady level that contains the same acoustic energy [17]. A-weighted, C-weighted and unweighted values are different quantities. OSHA notes that C-weighting is relatively flat and includes very low frequencies [18], so they are reported side by side, never subtracted as interchangeable exposures.
Change 2: Studies before and after construction become standard conditions
Loudoun County requires a pre-construction noise study at site plan review [5] and a post-construction study at least one month but no more than 12 months after the first Certificate of Occupancy [5]. Its zoning ordinance requires a Commonwealth-licensed professional engineer to prepare both [6]. Timing differs by authority. A Wisconsin utility-commission protocol for power plants asks for a post-construction study within twelve months of full operation [19], and a federal rule for gas compressor facilities requires a survey within 60 days of placing the facility in service [20]. These are analogies from other sectors, but they show that timing, receptor and operating condition are authority-specific parameters that belong in the acceptance specification rather than assumptions.
Change 3: Tonal and low-frequency content leaves the single A-weighted number
Loudoun's guidance states that dBA measurements "generally do not capture low frequency noise" ([5]) and that the county lacks tonal-specific language. A Virginia census of local instruments, authored independently and reported by Planetizen, counts only eight with any tonal provision and 10 with any low-frequency provision ([10]). That figure is the originating author's own tally and has not been independently verified here.
Other jurisdictions show what a tonal provision can look like. Maryland sets prominent discrete tones 5 dBA below its table level [21] and requires greater band prominence for low-frequency tones, 15 dB at 125 Hz and below [22]. Illinois uses octave-band limits and generally prohibits prominent discrete tones unless a third-octave band is at least 10 dB below the applicable limit [23]. A UK regulator guidance note says BS 4142 "is unlikely to be the appropriate methodology on its own" for low-frequency sound [24], and warns that objective tonality methods can miss moving or intermittent tones [25].
Health Canada defines infrasound as frequencies below 20 Hz ([26]) and notes that low-frequency sound passes through structures more readily ([26]). That is one reason property-line and indoor receptor readings describe different spectra. The practical consequence for acceptance is simple: report dBA for comparison with the ordinance, and add C-weighted levels, third-octave spectra and narrowband analysis where tonal or low-frequency content is plausible. The October 2026 review argues that "dB(A) alone is insufficient" for low-frequency tonal sources ([4]).
Change 4: Modeling and measurement are separate evidence classes
Predictions and field readings are not interchangeable. ISO 9613-2 is an engineering prediction method; its 2024 edition covers downwind propagation or an equivalent moderate inversion [8], and the earlier 1996 edition has been withdrawn [27]. The 1996 text gave an estimated accuracy of plus or minus 3 dB for specified geometries out to 1,000 m [9], excluded uncertainty in the source sound power [9] and derived its estimates from situations without reflection or screening effects [9]. Whether the 2024 edition's accuracy statement differs must be checked in its Clause 9 [8]. A peer-reviewed comparison of propagation models against 4 to 250 Hz measurements concluded that low-frequency performance "is generally not validated or guaranteed" [28].
Measurement has its own uncertainty. ISO 1996-2 sets no limit on allowable uncertainty and leaves it to be determined and reported ([29]). The practical rule is that a study states every model assumption ([30]), and an acceptance test reports measured uncertainty and background. Neither replaces the other.
A value not supplied stays unknown; it is never interpolated from a neighboring model.
Implementation Considerations and Process Changes
Step 1: Fix the decision, the parties and the dated authority text
Before any equipment is accepted, the acceptance specification should record the following.
- Authority and date: the controlling ordinance, permit condition or statute, its version and effective date, and any exemption. Loudoun's ordinance, for instance, carves out sounds from generators and accessory equipment operating during an emergency ([6]); the same exemption also covers operation at the request of a utility and the testing of those generators and associated equipment, so generator test runs may fall outside the lot-line limit and the contract may need a separate test-state requirement.
- Receptor basis: the property line, a residence, a school, or a facade. NYSDEC policy describes the property line as the most conservative reference point ([31]).
- Metric basis: weighting, descriptor, averaging time and meter response.
- Accountable parties: who supplies source data, who models, who measures, who certifies mitigation, and who pays for mitigation and retesting. These are contractual questions that public sources do not answer, so they stay explicit "to be agreed" fields.
Step 2: Build the equipment and operating-state register
The register lists every noise-relevant item: chillers, dry coolers, coolant distribution units (CDUs) and pumps where outdoor, fans, transformers, generators and any continuous on-site generation. EESI contrasts occasional emergency generators with turbines that "operate 24/7" [12], which is a different operating state class. For each item, record operating states: full load, seasonal and ambient conditions, redundancy and failure mode, routine test and emergency operation. The Coal City, Illinois noise study models chillers at about 86 percent capacity under N+2 redundancy [32] and assumes routine generator testing in daytime [32], showing how state assumptions drive results.
Vendor submittals should include, at minimum:
- Rating standard and test method: for air-cooled chillers, AHRI 370-2025 requires free-field tests following ISO 3744 as adapted ([14]) and unweighted octave-band sound power from 63 Hz to 8000 Hz ([14]).
- Uncertainty: AHRI 370 Appendix C lists expected maximum standard deviations by band ([14]); a dry-cooler datasheet cites tolerances of plus or minus 2 dB overall and 5 dB per octave band ([33]).
- Exact configuration: quantity, fan speed, load, enclosure and silencers. A chiller maker notes slight sound differences between otherwise identical units ([34]).
- Spectral data: one catalog states chiller sound power levels are "available on request" ([35]), so the request is part of procurement. A value not supplied stays unknown; it is never interpolated from a neighboring model.
- Test state for generators: which load, which enclosure, which exhaust configuration. Cummins notes unenclosed tests exclude exhaust noise and that it provides exhaust sound power data separately ([36]).
Step 3: Hand off to the acoustic specialist
The acoustician needs geometry, receptors, ambient characterization, terrain and buildings, propagation assumptions and the declared modeling standard. No simple inverse-distance formula can certify a multi-source, screened, tonal campus, so the hand-off package should state:
- Geometry and receptors: one study placed receptors at the nearest residences and occupied commercial and agricultural properties ([32]); Wisconsin's protocol sets modeled receptor height at window height for occupied buildings ([19]).
- Ground and propagation settings: the same protocol fixes ground factor G at 0.0 over water and hard ground and 0.5 elsewhere ([19]).
- Ambient characterization: that protocol recommends at least seven days of non-holiday data [19]; the October 2026 review proposes stations running at least 72 hours [4]. Background should exclude the source being assessed [25].
- Source treatment: model inputs should carry measured or declared spectra, including transformer hum. The Coal City study conservatively assigned transformer energy to the 125 Hz octave band ([32]).
Step 4: Control change between study and as-built
Substitutions are the main way a defensible study becomes obsolete. A change register compares the study basis with the installed bill of materials and flags differences before equipment is accepted. Typical triggers:
- Equipment substitution: model, quantity or manufacturer differs from the modeled source.
- Fan control changes: firmware or setpoints. Vendors describe sound-limiting modes and night-time fan speed control ([34]) ([35]), so a software change can change the source state.
- Enclosure, silencer or barrier changes: the Coal City study states that insertion-loss values come from published manufacturer data ([32]), which are design assumptions until verified.
- Power plant and capacity changes: continuous on-site generation or added cooling capacity. Loudoun's draft amendment (not adopted) would require a cumulative sound profile of the campus ([37]).
- Environmental drift: generator sound is affected by air density, which varies with temperature ([36]).
Step 5: Plan the post-construction acceptance test
The plan should be agreed with the authority before commissioning and should specify the following.
- Instruments: IEC 61672-1 defines class 1 and class 2 meters (Source: webstore.iec.ch); IEC 60942 covers field calibrators (Source: webstore.iec.ch). Loudoun requires a Type 1 integrating meter [6].
- Calibration: FHWA says to calibrate at the beginning and end of each session ([38]); Wisconsin notes any drift above 1 dB ([19]).
- Placement: Loudoun fixes position at the receiving lot line closest to the source ([6]), Wisconsin places microphones at about 1.2 to 1.5 m ([19]).
- Weather and time: FHWA says to avoid measuring when winds exceed 11 mph ([38]); UK guidance requires on-site weather data ([25]).
- Background and controlled states: Wisconsin's post-construction method uses scheduled shutdowns for background subtraction ([19]) and runs the facility at maximum emissions for each condition ([19]).
- Spectral analysis: the October 2026 review proposes narrowband analysis at 1 Hz or finer ([4]).
- Results and uncertainty: report values with the background correction applied or not applied, and the stated uncertainty.
Step 6: Disposition and change triggers
Each receptor and state ends in one of five dispositions: conforming, conforming with stated assumptions, unresolved (missing data or invalid conditions), corrective work required, or retest required. Loudoun's ordinance requires mitigation to be certified when a study exceeds the limit ([6]); the federal compressor rule requires a follow-up survey after mitigation ([20]). Acceptance conditions should name the change triggers (fan firmware, enclosure, power plant, cooling capacity) that reopen the disposition.
- 01Fix the decision basis
Record the dated authority text, receptor, metric and accountable parties before equipment is accepted.
- 02Register equipment and states
List noise-relevant equipment and its load, seasonal conditions, redundancy, failure mode, routine test and emergency operation.
- 03Hand off to the acoustician
Supply geometry, receptors, ambient characterization, terrain, buildings, propagation assumptions and the modeling standard.
- 04Control study-to-as-built changes
Compare the study basis with installed equipment and flag substitutions, controls, barriers and capacity changes before acceptance.
- 05Plan the acceptance test
Agree the plan with the authority before commissioning. Specify instruments, calibration, placement, weather, background, states, spectra and uncertainty.
- 06Disposition and reopen when needed
Record each receptor and state as conforming, conforming with stated assumptions, unresolved, corrective work required or retest required.
Data Analysis and Evidence
- Describes the source and does not depend on observation distance.
- A sound power column without octave data is incomplete evidence for a tonal-sensitive site.
- Changes with distance, position and environment.
- Near-source pressure values need a propagation study before use at a property line.
Placed in one column, equipment values can imply a spread that reflects reference quantity and distance rather than equipment quality.
The sourced numbers in this report are not comparable with one another, which is itself the main analytical finding. Public documents give a Caterpillar spec sheet with 7 m levels of 81, 78, 76 and 74 dBA depending on enclosure [39]; a dry cooler with a sound power of 94 dB(A) and a pressure of 61 dB(A) at 10 m [33]; an air-cooled chiller line listing sound power of 108 dB(A) with a pressure value but no stated distance [40]; a free-cooling chiller at 1 m [3]; and a CDU at 1 m [41]. Placed in one column these would imply a spread of several tens of decibels (for example, 108 dB(A) sound power beside 61 dB(A) pressure at 10 m) that reflects reference quantity and distance, not equipment quality.
Table 1 below shows the equipment and state register template, populated with the kind of public information that exists for each class and the information that must stay unknown until a submittal supplies it. Entries are vendor or standards statements, not measurements by the author.
| Equipment class | States to register | Public example of the quantity (vendor or standard statement) | Spectrum and uncertainty basis | Missing until submitted |
|---|---|---|---|---|
| Air-cooled chiller | Full load, part load, night or sound-limiting mode, failure mode | Rated to AHRI 370 free-field method ([14]); part-load sound differs from full-load ([34]) | Octave 63 to 8000 Hz; Appendix C deviations | Exact model sound power at duty point; low-frequency band values |
| Dry cooler / fans | Fan speed steps, ambient temperature | LwA and LpA at 10 m, free field over reflective plane ([33]) | EN 13487 tolerances; octave rows blank on the example sheet | Octave sound power; tonal content at low speed |
| Generator set | Unloaded, 100% load, routine test, emergency | 7 m, A-weighted, eight positions ([15]) | Position levels vary by direction ([15]) | Exhaust sound power; test-day duration |
| Transformer | Energized no load, under load | NEMA levels established at no load unless otherwise specified ([42]) | IEC 60076-10 is mainly factory measurement (Source: webstore.iec.ch)) | Site reflections; tonal content |
| CDU and pumps | Pump speed, indoor or outdoor placement | Indoor CDU level at 1 m ([41]) | No standard or duty point stated on the leaflet | Outdoor heat-rejection plant is separate equipment |
| Continuous on-site generation | Continuous 24/7 | Described as continuous, unlike backup units ([43]) | Unknown | Entire acoustic specification |
The register's value lies in its blank cells. The interpretive point is that a populated Lw column with an empty octave column is incomplete evidence for a tonal-sensitive site, and a 1 m or 7 m pressure value cannot be carried to a property line without a propagation study.
Table 2 below gives the receptor and metric matrix, with Virginia and other published provisions as the limit and authority examples. Modeled and measured columns are intentionally left as fields for the project to fill.
| Receptor or position | Metric, weighting, period | Limit, authority, date (examples; verify) | Modeled | Measured | Calibration and background | Disposition |
|---|---|---|---|---|---|---|
| Receiving lot line (Loudoun, Virginia) | dB(A), FAST, 15 s samples, at least 3 ([6]) | 55 dB(A) residential and rural economy, 70 industrial receiving development ([6]) | To be supplied | To be supplied | Type 1 meter; sound must be clearly audible ([6]) | Pending |
| Receiving land, octave band (Illinois) | Octave-band dB, 31.5 Hz to 8 kHz | Daytime Class A to Class A: 72 dB at 31.5 Hz, 71 at 63 Hz, 65 at 125 Hz ([44]) | To be supplied | To be supplied | Measured at least 25 feet from the source ([44]) | Pending |
| Residential or school within 500 feet (Virginia statute) | Not named in the statute | Sound profile examined to the extent practicable ([7]) | To be supplied | To be supplied | Metric and standard set by the locality | Pending |
| Facade or indoor receptor | LAeq, LCeq, third-octave, tonality | No universal limit; WHO values are long-term averages (Source: cdn.who.int)) | To be supplied | To be supplied | Background L90 excluding the source | Pending |
| Background or control station | L90, spectra, 72 hours or more | Not a limit | Not applicable | Required before operation | L90 is the level exceeded 90 percent of a period ([45]) | Reference only |
The matrix works only when each row names its authority and effective date, because limits differ by zoning district and receptor. The Loudoun ordinance table spans 55 to 70 dB(A) by receiving use, and a post-construction result can only be dispositioned against the row's own metric and period.
Citation Audit: Following the 96 dBA Reference to Its Boundary
The 96 dBA figure is a useful case because it carries a specific scope. The Tao and Gao paper, published in Eco-Environment and Health, says data centers generate noise "primarily from diesel generators and Heating, Ventilation, and Air Conditioning (HVAC) systems" [11] and gives the figure as internal noise reaching up to 96 A-weighted decibels, which is "well above the 85 dBA threshold considered harmful to hearing" [11]. The paper is a perspective that calls for studies to quantify noise exposure [11]. The perspective gives no property-line level.
An Indiana University community fact sheet keeps the boundary: it says internal levels can reach 96 dBA, "potentially harming staff" ([46]), and gives a separate external range of 55 to 85 dBA or higher ([46]) without naming a measurement distance. Some secondary coverage repeats the figure without stating where it was measured; a value reported without a location is not usable as exposure evidence until its source is traced.
Table 3 below is the source-to-claim ledger the audit produces. Each row labels the claim's location and what it may be used for.
| Claim as circulated | Source hop | Stated scope in the source | Location label | Permitted use |
|---|---|---|---|---|
| "96 dB for 24 hours a day and seven days a week" | Secondary coverage | Sentence has no location qualifier | Unlabeled | Not usable as exposure evidence |
| Up to 96 dBA | Tao and Gao perspective (2025) | Internal noise levels ([11]) | Internal | Indoor occupational context |
| Internal 96 dBA; external 55 to 85 dBA | Indiana University fact sheet (updated August 11, 2026) | Internal levels separated from external ([46]) | Internal and external, no distance for external | Context, with the missing distance flagged |
| Near-source readings of 1 to 2 m | October 2026 arXiv review | Describe equipment items, not community exposure ([4]) | Near-source | Equipment-level only |
| Generator noise up to 105 dB | Secondary explainer, pointing to a vendor page | A-weighting and distance not stated in the explainer | Unlabeled | Use only after the vendor's reference distance is read |
The ledger rule is mechanical: no value enters a neighbor-exposure sentence unless its row shows a property-line or receptor location, a weighting, a period and an instrument basis. The October 2026 review makes the same point about pooling, saying values "do not support a pooled range or aggregate comparison with nighttime limits" [4] and that none of its summarized values meets its top provenance tier [4]. It is a narrative review without formal screening or quantitative synthesis [4], and it notes that facilities enter public documentation largely because residents raised concerns [4]. Resident reports are therefore a prompt for measurement, not evidence of exposure level or of any health outcome, and this report draws no causal health conclusion.
Case Studies and Real-World Examples
Virginia worked requirements example (as of November 2026; verify the controlling text)
Virginia Code 15.2-2209.5 requires a locality to require a site assessment before approving a rezoning, special exception or special use permit for a new high-energy-use facility [7]. The threshold is anticipated demand of 100 megawatts or more [7], expansions are addressed by a separate exception whose wording is awkward [7], and the section preserves existing local zoning authority [7]. The statute names no metric, standard or numeric limit, and the statute text lists 2026 acts but states no separate effective date [47]. A project team must therefore confirm whether the project falls within the provision, its exceptions and its effective date.
Loudoun County then supplies the measurement mechanics: a limit measured in dBA at the receiving property line for different zoning districts [5], the 5 foot microphone height, and at least three samples. Its October 2026 handout lists proposed, not adopted, measures for low-frequency and tonal measurement [48], and the county page anticipates amendments in spring or summer 2027 [5]. A draft redline would define a permanently installed noise monitoring system [37]. The worked example's lesson is the gap between a statute that asks for a sound profile and an ordinance whose test method is a dBA lot-line sample: the acceptance specification must bridge it with spectra and states.
Published study scope: Coal City, Illinois (method facts only)
A July 2026 environmental noise study posted by the Village of Coal City, Illinois, for a proposed campus illustrates a transparent scope. It measured ambient levels at three locations [32], used hourly L90 to judge whether ambient supersedes the ordinance limit [32], modeled in CadnaA with topography and screening [32], converted manufacturer A-weighted octave sound power data [32] and explained why octave bands matter: "It is possible to comply with the overall dBA rating while failing to comply" band by band [32]. It does not state a post-construction acceptance test, which is the part this report's matrix adds.
(Hypothetical Example) Combining sources and averaging time
Suppose two independent identical units each contribute 50 dB at a receptor, with a third contributing 47 dB, all on the same weighting and averaging basis. The energy sum is 10 log10(2 x 10^5.0 + 10^4.7), about 54.0 dB, not 147 dB and not 53 dB. If a level is 50 dB for 10 minutes and 60 dB for 10 minutes, the energy average is about 57.4 dB, not the arithmetic 55 dB. For background correction, a Minnesota guide's example subtracts 2 dB from an 84 dBA total when the source-off background reads 80 dBA ([49]). These are arithmetic illustrations only and carry no site meaning.
The ledger rule is mechanical: no value enters a neighbor-exposure sentence unless its row shows a property-line or receptor location, a weighting, a period and an instrument basis.
Implications and Future Directions
Public requirements are moving. Loudoun's county page places amendments in 2027 and the handout proposes regular post-construction studies in the first year [48], so an acceptance specification should reference a dated text and a re-verification step. Standards are also revising: ISO 3744 has a 2025 edition that replaces the 2010 one [50] [51], so submittals should state the edition used.
Cooling architecture needs careful language. EESI states, without a citation of its own, that data centers that use cooling systems, rather than water cooling, "tend to be noisier" [12], and the October 2026 review says its 15 to 30 dB architecture span is "an equipment-level sound-power estimate, not a measured facility- or residential-receptor difference" [4]. Liquid cooling inside the data hall may still leave outdoor heat-rejection fans, pumps or backup generators on site, so the register should still list them. The evidence agenda the review proposes, at least a week of continuous night data at several facilities [4], would make future comparisons possible. For buyers, the implication is to request the register, the receptor matrix and the change register as contract deliverables, and to treat the acoustician and the authority as the arbiters of metrics. GPU Smith's role is limited to structuring the procurement evidence; the acoustic judgment belongs to the project's licensed professionals.
Frequently Asked Questions (FAQs)
How is data center noise measured at the property line? Through a defined position, meter class and descriptor. Loudoun measures at the receiving lot line nearest the source at 5 feet ([6]), and Illinois measures at least 25 feet from the source property line ([44]). The position is always set by the authority.
What does data center acoustic acceptance testing include? Calibrated instruments, documented weather, background characterization, controlled equipment states, spectral analysis and reported uncertainty, as in Step 5. A UK implementation document says to minimise uncertainty rather than try to give it a number ([25]), so the uncertainty policy should be agreed up front.
How do you measure noise levels in dBA, and what is ISO 1996's role? dBA uses a frequency weighting that reflects sensitivity by frequency [45]. ISO 1996-1 defines basic quantities and assessment procedures [13] and ISO 1996-2 covers determining levels by measurement and extrapolation [29].
What about noise ordinance compliance? It depends on the local text. Limits in the sourced examples range from 55 to 70 dB(A) in Loudoun, while Maryland measures at points on or within the property line of the receiving property ([21]). Check applicability, exemptions and dates.
What counts as evidence in a noise complaint? Resident reports indicate where to measure; they do not establish level, spectrum or health effects. Evidence needs records of which equipment was running ([52]) and background measurements before operation ([52]).
How is low-frequency noise measured? With C-weighted levels, third-octave or narrowband spectra, and tonality analysis. German practice described by the Danish EPA treats noise as low-frequency when the C-weighted level is at least 20 dB above the A-weighted level (Source: www2.mst.dk)).
Modeling versus field measurement? Models inform design and permitting; field measurement accepts the installation. Post-construction monitoring can determine whether predictions were accurate ([52]).
How does sound power for cooling equipment differ from sound pressure? Sound power describes the source and does not depend on observation distance, whereas sound pressure changes with distance, position and environment ([53]).
Conclusion
Acoustic acceptance for an AI data center is a chain of labeled evidence from submittal to receptor, and each link can be audited. The decision frame separates contractual limits, planning conditions and health guidance; the quantity dictionary separates sound power, near-source pressure, property-line level and receptor observations; the registers tie each equipment item and state to a source document, a modeled value and a measured value. Unknown values stay unknown, and a change in fan firmware, enclosure, power plant or cooling capacity reopens the disposition.
The 96 dBA example shows why. A value that is accurate in its own scope can be misread when the scope is lost, and the remedy is a ledger rather than a different number. The Virginia case study above shows the remaining gap between a required sound profile and a dBA lot-line sample. Readers should take the matrices to the project acoustician and the authority, confirm the controlling text and effective date, and treat this report as a specification aid rather than a design, a measurement or a legal opinion.
External Sources (53)
About
GPUSmith
Plan and build private AI compute with GPU Smith. We connect workload requirements with GPU hardware, networking, deployment and operating decisions so your infrastructure fits the work it must perform.
GPU Smith provides independent engineering and research for private AI infrastructure. We help technical buyers and operators reason about GPU workload sizing, hardware selection, procurement, deployment and inference operations, from the compute system to the networking, power and cooling requirements around it.
Start with the workload
Useful infrastructure decisions begin with the models, data, throughput, latency and operating constraints a team actually has. GPU Smith helps connect those requirements with system design and deployment choices. The goal is a privately controlled AI environment whose capacity and operational demands are understood before a purchasing decision.
Hardware and supplier research
Our public reference library covers GPUs, complete systems and networking components. The server-vendor directory and manufacturing research help teams investigate suppliers, compare options and follow sources behind technical claims. We distinguish manufacturer specifications from measured benchmarks and advertised capabilities from tested configurations. Reference pages are research resources, not a live inventory listing or a binding equipment quote.
Deployment and operations
GPU Smith's engineering scope includes infrastructure integration, networking, power, cooling and the practical operation of inference workloads. Our published articles explain the tradeoffs behind deployment, procurement and ongoing operations so teams can ask better questions and document decisions.
Work with GPU Smith
Explore the hardware library, GPU references, networking references and vendor research. Contact GPU Smith with your workloads and deployment constraints to discuss a project and confirm current scope, pricing and availability.
Inclusion of a manufacturer or product in our research does not imply a partnership, certification or endorsement.
Disclaimer
This document is provided for informational purposes only. No representations or warranties are made regarding the accuracy, completeness, or reliability of its contents. Any use of this information is at your own risk. GPUSmith shall not be liable for any damages arising from the use of this document. This content was generated with assistance from artificial intelligence tools, which may contain errors or inaccuracies. Readers should verify critical information independently. All product names, trademarks, and registered trademarks mentioned are property of their respective owners and are used for identification purposes only. Use of these names does not imply endorsement. This document does not constitute professional or legal advice. For specific guidance related to your needs, please consult qualified professionals.