GPUSmith Article
AWS P5e vs P5en: H200 Network Premium Break-Even
Compares AWS P5e and P5en for 8-to-32-node H200 fine-tuning in 2026: a 15.0% rate premium ($54.924 vs $63.158 per node-hour), a 1.150x break-even speedup, fixed-block rounding and a benchmark protocol.
Summary
- 01P5e and P5en carry the same eight H200 GPUs and GPU memory. P5en changes the host and fabric while keeping the same advertised EFA bandwidth.
- 02The Ohio Capacity Block rates put P5en at a 15.0% premium. At equal node counts under time-based billing, it must complete jobs more than 1.150 times as fast to lower compute cost.
- 03Prepaid reservations turn break-even into a staircase: a 7-day P5e job needs at least 1.167 times speedup to fit a 6-day P5en block. A 1.15 speedup still requires buying 7 days.
- 04The quantified 35% latency claim uses P5 as its baseline and does not establish faster training against P5e. The article found no independent same-workload training comparison.
- 05Freeze the workload and software stack, measure time to the same quality target, and decide using the lower bound of measured speedup. Attribute gains to exposed collectives, host stalls or checkpoint staging.
Inside this article
Executive Summary
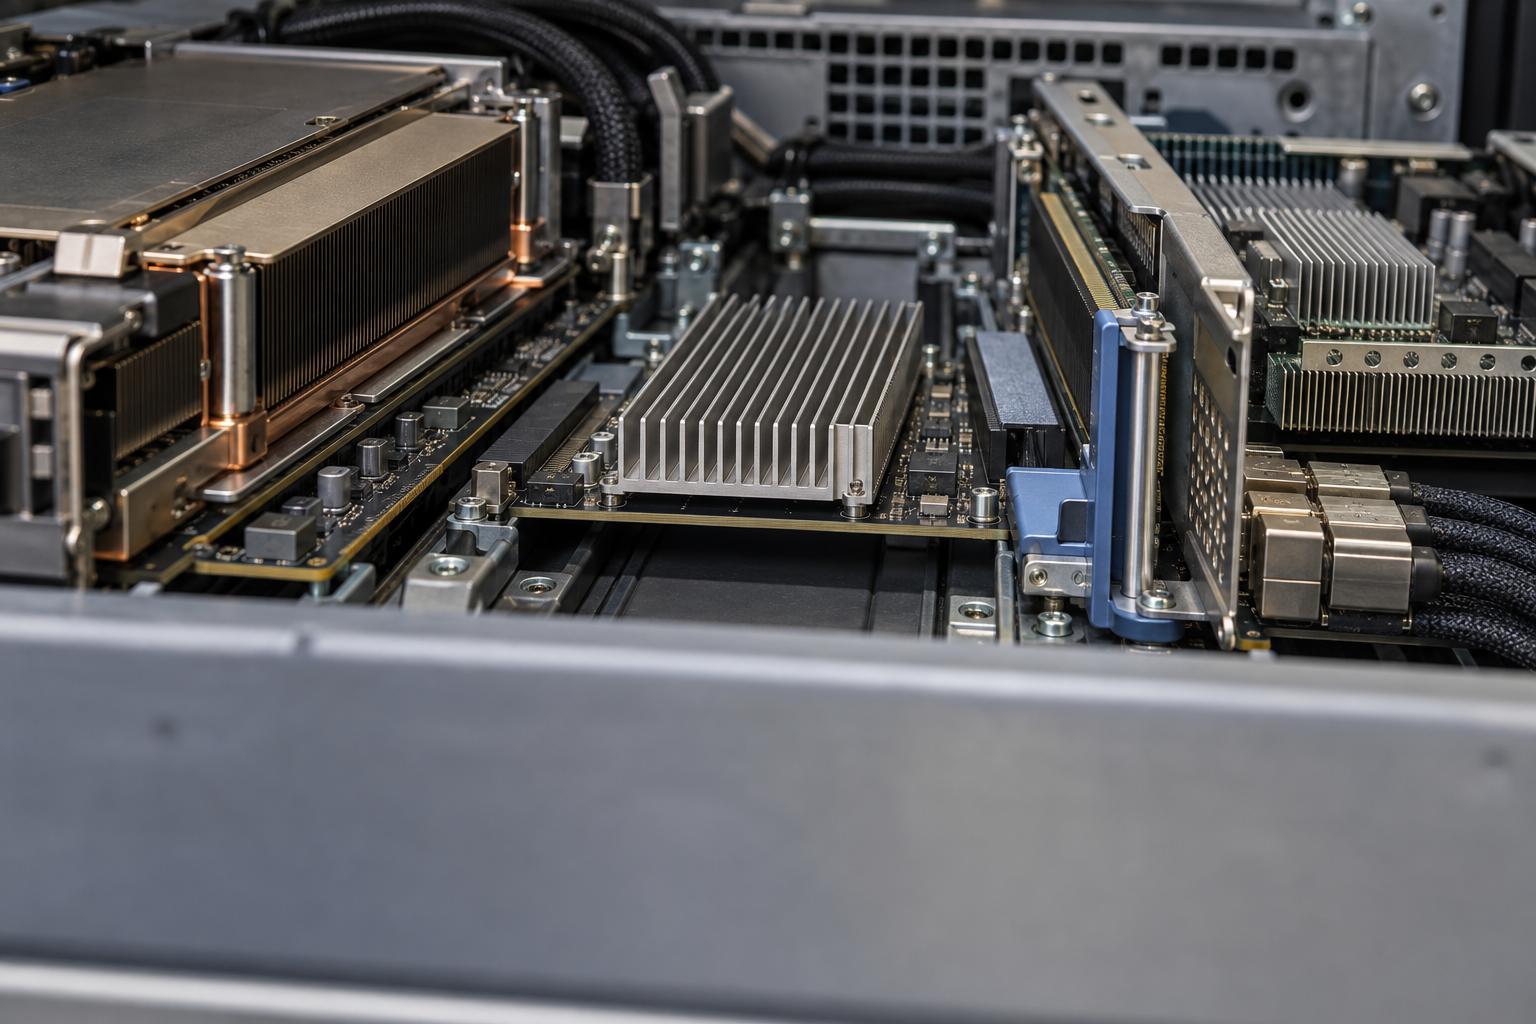
EC2 P5e (p5e.48xlarge) and P5en (p5en.48xlarge) carry the same GPU payload: eight NVIDIA H200 GPUs and 1,128 GB of HBM3e GPU memory per node, with up to 3,200 Gbps of Elastic Fabric Adapter (EFA) networking on both [1]. What differs is the host and fabric: P5en pairs the GPUs with an Intel Sapphire Rapids CPU, PCIe Gen5 between CPU and GPU, and third-generation EFA on Nitro v5 [1]. AWS quantifies two of these changes, and neither is a P5e-to-P5en training result: "up to four times" CPU-to-GPU bandwidth versus P5 and P5e, and "up to 35%" lower latency versus P5 only [2].
The price gap is 15.0%. On the AWS Capacity Blocks for ML table retrieved 2026-10-29, US East (Ohio) lists p5e at $54.924 [3] and p5en at $63.158 [3] per node-hour, a premium of $8.234 per node-hour. These are the current rates; a secondary vendor's July 2026 snapshot of per-GPU-hour rates, $5.97 for P5e and $6.865 for P5en, implies a similar gap (Source: www.spheron.network). AWS says the next scheduled price update is January 2027 [3].
The break-even is a ratio, not a latency claim. At identical node counts and time-based billing, P5en lowers compute cost per completed job only if it completes work at more than 63.158 / 54.924 = 1.150 times P5e's rate. For a prepaid Capacity Block the test is harsher: reservations come in one-day steps up to 14 days, so a 7-day job needs a speedup of at least 7/6 = 1.167 before a 6-day block can be bought [4]. The 8-node, 7-day premium at live rates is $11,066.50.
Nobody has published the matched measurement. As of 2026-10-29 our searches found no independent same-workload P5e-versus-P5en training comparison. Published scaling studies on other fabrics show model FLOPs utilization (MFU) ranging from 55% for well-overlapped runs to much lower values for communication-bound, small-batch runs [5] [6], so a 1.15x gain is plausible for sharded 32-node jobs and implausible for compute-bound ones. This report therefore supplies a benchmark protocol at 1, 8 and 32 nodes, a threshold table, fixed-block and deadline-value sensitivities, and a bottleneck attribution table, so that each assumption can be replaced with a measured value before a block is bought.
Introduction and Background
Training-platform engineers and cloud finance owners planning an 8-to-32-node H200 fine-tuning job on AWS face a narrow but expensive choice. Two instance types expose the same eight H200 GPUs, each with 141 GB of HBM3e at 4.8 TB/s [7]. One costs 15% more per node-hour, and AWS markets it with host and network improvements whose only quantified latency claim uses a different baseline than the one the buyer cares about. This report, written from an analyst's perspective, converts each claim into a threshold on completed-job speed.
Job and deployment assumptions
Every comparison below holds the following reference job fixed. Buyers may substitute their own values, but must keep each item identical across both instance types.
- Model and method: a dense decoder-only transformer of roughly 30 billion parameters, fine-tuned with fully sharded data parallelism (FSDP, which shards parameters, gradients and optimizer state across GPUs). Mixed-precision Adam needs 16 bytes of model state per parameter [8], about 480 GB, so a one-node baseline fits in 1,128 GB of HBM.
- Node counts: 1, 8 and 32 nodes (8, 64 and 256 GPUs).
- Data and checkpoints: a fixed token budget read from Amazon FSx for Lustre, with a full checkpoint written to the same file system at a fixed interval (for example every 30 minutes).
- Region and purchase method: one Region and Availability Zone, one reservation method; US East (Ohio) is the reference price Region because both types are listed there (Table 2).
- Software stack: identical operating system, CUDA, NCCL, EFA installer, libfabric, aws-ofi-nccl plugin, container image and training code.
- Acceptance criterion: wall-clock time to a stated held-out quality target, not tokens per second at an arbitrary step.
The rest of the report reads as a worksheet: what AWS has documented, what it has not, what the dated price ledger says, and which measurements decide the outcome.
EC2 P5e (p5e.48xlarge)
Capabilities
P5e pairs eight H200 GPUs with 3rd Gen AMD EPYC processors, 2 TiB of system memory and second-generation EFA [2]. AWS's specification table lists the host CPU as AMD EPYC 7R13 [9]. Network bandwidth is the same 3,200 Gbps headline as P5en, delivered through 32 network cards, of which up to 800 Gbps can carry IP traffic [10].
Adoption
AWS announced P5e on 2024-09-09 for EC2 Capacity Blocks, first in US East (Ohio) [11]. On the 2026-10-29 Capacity Blocks table p5e is listed in 11 locations, including US East (Ohio), US West (Oregon), US West (N. California), Europe (London) and Europe (Stockholm); US East (N. Virginia) is not among them. Availability in a specific zone must be checked at purchase, because a search returns up to six candidate offerings with their own start times [12].
Strengths and Limitations
- Strength, lower rate: $54.924 per node-hour in US East (Ohio), the cheaper way to buy eight H200 GPUs per node on the table (Table 2).
- Strength, established recipes: P5 and P5e share the 32-card EFA layout, so one NCCL and EFA recipe covers both.
- Limitation, host and EFA generation: AWS frames the P5en improvements against this host and EFA generation.
- Limitation, EBS: 80,000 Mbps of EBS bandwidth against 100,000 Mbps for P5en, relevant only if data or checkpoints travel over EBS.
- Limitation, On-Demand: the launch announcement positioned P5e for Capacity Blocks, and this research found no On-Demand p5e price in AWS's pricing feed for US East (N. Virginia), so On-Demand P5e needs its own quote.
EC2 P5en (p5en.48xlarge)
Capabilities
P5en keeps the eight H200 GPUs and the 1,128 GB memory but changes the host: a custom 4th generation Intel Xeon Scalable processor with a 3.2 GHz all-core turbo, 50 percent higher memory bandwidth and up to four times the CPU-to-GPU throughput through PCIe Gen5 [2]. The network moves to third-generation EFA on Nitro v5 with the same 3,200 Gbps headline but 16 network cards instead of 32 [13].
Adoption
P5en reached general availability on 2024-12-02 in US East (Ohio), US West (Oregon) and Asia Pacific (Tokyo) [14], and by 2025-03-27 had expanded to US East (N. Virginia), Europe (Spain) and several Asia Pacific Regions. The live Capacity Blocks table lists p5en in 12 locations, including N. Virginia and Spain, which p5e lacks. In June 2025 AWS announced price reductions of up to 26% for P5en [15]. Plan-based discounts do not reach Capacity Blocks, because Savings Plans and Reserved Instance discounts do not apply to them [16].
Strengths and Limitations
- Strength, CPU-to-GPU link: the PCIe Gen5 path matters for host-to-device copies such as data batches and checkpoint staging, where AWS claims up to four times the bandwidth of both P5 and P5e.
- Strength, EFAv3: an AWS-authored post says EFAv3 reduces packet latency by approximately 35% compared to EFAv2 [17], and an independent group measuring p5en (EFAv3, 16 network cards of 200 Gb/s) reports that EFA saturates network bandwidth for large messages [18].
- Strength, EBS: 100,000 Mbps of EBS bandwidth versus 80,000 Mbps for P5e.
- Limitation, claim baselines: the quantified latency claim compares P5en with P5, and the 4x figure is an "up to" claim.
- Limitation, price: $63.158 per node-hour in US East (Ohio) (Table 2).
A buyer should compute days needed from the lower bound of the measured speedup and round up; since blocks cannot be cancelled, an optimistic estimate cannot be corrected after purchase.
Feature Comparison
Table 1 places the two types side by side and records, for each difference, the exact baseline AWS uses. The right-hand column exists to stop a P5-versus-P5en claim from being read as a P5e-versus-P5en claim.
| Attribute | p5e.48xlarge | p5en.48xlarge | AWS claim baseline and caveat |
|---|---|---|---|
| GPUs and GPU memory | 8 x H200, 1,128 GB HBM3e | 8 x H200, 1,128 GB HBM3e | Identical per AWS; 141 GB per GPU per NVIDIA [7] |
| Host CPU | AMD EPYC 7R13 | Intel Xeon Sapphire Rapids [9] | Qualitative; the 50 percent memory-bandwidth figure has no stated baseline |
| CPU-to-GPU link | Earlier host generation | PCIe Gen5, up to 4x bandwidth | Baseline is P5 and P5e; "up to" [1] |
| EFA generation | Second generation | Third generation, Nitro v5 | Up to 35% lower latency versus P5, not P5e [1]; AWS-authored post words it as versus EFAv2 [17] |
| EFA headline bandwidth | Up to 3,200 Gbps, 32 network cards | Up to 3,200 Gbps, 16 network cards | Same headline; card layout differs |
| EBS bandwidth | 80,000 Mbps [9] | 100,000 Mbps [9] | Specification table |
| Capacity Block rate, US East (Ohio), 2026-10-29 | $54.924 per node-hour | $63.158 per node-hour | Premium $8.234 or 15.0% (Table 2) |
| Capacity Blocks locations | 11, no N. Virginia | 12, includes N. Virginia | Per the same rate table |
Every training-relevant quantity that the GPU determines (memory capacity, NVLink bandwidth, FP8 and BF16 compute) is identical. Everything that differs sits in the host and fabric. AWS's own wording is not uniform: its P5 page says P5en has lower network latency "compared to P5e and P5 instances" in one sentence and quantifies 35% against P5 alone in the next. A later AWS-authored post words the same figure as EFAv3 versus EFAv2 packet latency; because P5e also uses EFAv2, a latency gain over P5e is plausible, but no instance-level number exists. A finance owner should treat the P5e comparison as qualitative until measured.
- Eight H200 GPUs, AMD EPYC processors and second-generation EFA.
- Up to 3,200 Gbps of networking through 32 network cards.
- The cheaper way to buy eight H200 GPUs per node in the Ohio table.
- The same GPU payload, with Intel Sapphire Rapids, PCIe Gen5 and third-generation EFA on Nitro v5.
- The same 3,200 Gbps network headline, with 16 network cards instead of 32.
- A 15.0% rate premium requires a measured gain in completed-job speed.
The quantified latency claim compares P5en with P5. Treat the P5e latency comparison as qualitative until measured.
Price Ledger and Reservation Mechanics
aws p5e.48xlarge pricing and aws p5en.48xlarge pricing
Table 2 is a dated price ledger for the reference Region, followed by the 8-node, 7-day worksheet (8 nodes x 168 hours = 1,344 node-hours). The live rows are read from the AWS table on 2026-10-29, and the operating-system fee rows come from the OS pricing section of the same AWS page.
| Item | p5e.48xlarge | p5en.48xlarge | Difference |
|---|---|---|---|
| Rate per node-hour, 2026-10-29 table (US East, Ohio) | $54.924 [3] | $63.158 [3] | $8.234 (15.0%) |
| Per accelerator, live | $6.866 | $7.895 | $1.029 |
| 1 node, 24 hours, live | $1,318.18 | $1,515.79 | $197.62 |
| 8 nodes, 7 days (1,344 node-hours), live | $73,817.86 | $84,884.35 | $11,066.50 |
| 8 nodes, 14 days, live | $147,635.71 | $169,768.70 | $22,132.99 |
| 32 nodes, 7 days, live | $295,271.42 | $339,537.41 | $44,265.98 |
| OS fee per node-hour, Linux | $0.000 | $0.000 | none |
| OS fee per node-hour, Ubuntu Pro / RHEL | $0.336 / $1.8432 | $0.336 / $1.8432 | none |
The premium is 15.0% of the p5e rate in the live table, so the break-even ratio is 1.15 regardless of the absolute rate level; the absolute premium for the reference worksheet is $11,066.50. Operating-system fees are identical across the two types, so they add to both sides of the ratio and nudge the threshold slightly below 1.150. The ledger omits storage, data transfer and engineering time; for the same file system and job those do not depend on instance type except through job length.
Earlier rates versus live rates
The live AWS page on 2026-10-29 shows per-accelerator rates of $6.866 for P5e and $7.895 for P5en (Table 2). A secondary vendor's snapshot of rates as of July 2026 ($5.97 per P5e GPU-hour and $6.865 per P5en GPU-hour) reports a roughly 20% AWS increase effective July 1, 2026; treat this as an unverified third-party snapshot rather than an AWS-confirmed figure (Source: www.spheron.network). The reservation price is fixed once the block is reserved [4], so capture a purchase-time quote and do not reuse any figure in this report as a quote.
Reservation mechanics that affect the cost per job
- Size and duration: up to 64 instances per block [19], for one to 14 days in one-day steps and then multiples of 7 days up to 182 [4]. Eight and 32 nodes fit, although 64-instance blocks are not offered for every type in every Region.
- Payment: the reservation fee is charged up front when the reservation is made [16].
- No cancellation: Capacity Block cancellations are not allowed, so an oversized block is a sunk cost [19].
- End of block: every block ends at 11:30 UTC [19], and termination starts at 11:00 UTC, so the usable window is about half an hour shorter than the paid one.
On-Demand pricing
On-Demand purchase carries a separate rate. AWS's public pricing feed, timestamped 2026-10-28, lists p5en.48xlarge Linux On-Demand at $63.296 per hour in US East (N. Virginia), within 0.2% of the Capacity Block rate [20]. No On-Demand p5e price for that Region was established, so a buyer who wants On-Demand P5e should obtain a quote rather than reuse the Capacity Block figure.
aws h200 instances comparison across providers
For context only, CoreWeave lists an on-demand HGX H200 node at $50.44 per hour [21], Google Cloud lists an a3-ultragpu-8g node (eight H200 GPUs) in its accelerator-optimized table [22], and Microsoft's retail price API lists Azure ND96isr H200 v5 [23]. These are not like-for-like with a prepaid Capacity Block, because commitment, networking and Region differ, and a secondary vendor characterizes an earlier AWS table change as "a rate card change, not a live market signal" (Source: www.spheron.network). They show that the P5e-versus-P5en choice is a within-AWS decision of roughly $8 per node-hour on a base of about $55.
Performance and Benchmarks
What is measured, and what is not
AWS has published no P5e-versus-P5en training benchmark. The only quantified network claim is 35% lower latency, stated against P5 in the AWS P5 page and 2024 launch announcement and against EFAv2 in a 2026 AWS-authored post [17]. Latency is not throughput. NVIDIA's guidance is that at very small NCCL message sizes performance is dominated by latency [24], and the "Demystifying NCCL" analysis says the low-latency LL and LL128 protocols are typically chosen for small messages while the Simple protocol gives bandwidth on large messages but suffers from high latency [25]. Both instance types advertise the same 3,200 Gbps, so an EFAv3 gain should concentrate where collectives are latency bound: many layers, small shards and large rank counts. An independent EFAv3 measurement reports saturation for large messages and flags small-message rate as a weakness [18].
AWS's NCCL validation guide lists an expected all-reduce bus bandwidth of about 400+ GB/s for p5.48xlarge, has no p5e or p5en row, and warns that an all-sizes average is a misleading metric [26]. The nccl-tests project defines bus bandwidth so that it can be compared with hardware peak independent of rank count, and says it should reflect the bottleneck link: NVLink, PCI or network [27].
h200 multi-node training network bandwidth requirements
Fabric sensitivity depends on arithmetic intensity, not instance name. MFU is defined as observed tokens per second relative to the theoretical maximum at peak FLOPs [28]. Meta's analysis of Llama 3 parallelism explains that FSDP at about 8K tokens per GPU has an arithmetic intensity well below the hardware ratio of peak compute to network bandwidth, so communication is hard to hide [29]. Published studies, all on fabrics other than EFA, show the range:
- Llama 3 405B: 38% to 43% BF16 MFU on up to 16K H100 GPUs with 400 Gbps interconnects; Meta attributes the dip from 43% to 41% at 16K GPUs to a smaller batch per data-parallel group, not to the network [30].
- MegaScale: 55.2% MFU on 12,288 GPUs, with strong-scaling MFU falling from 59.1% to 55.2% as the computation-to-communication ratio decreased [5].
- FSDP at fixed batch: excess parallelism makes compute-bound workloads communication bound, and standard FSDP training of 7B models becomes communication bound beyond 128 H100 GPUs [6].
- ZeRO-3 at scale: on A100 with HDR InfiniBand, a LLaMA 13B ZeRO-3 run fell from 47% MFU at 8 GPUs to 4% at 1,024 GPUs, a worst case for pure sharding [31].
- Bandwidth sensitivity: a MICRO 2025 study on 32 H200 and 64 H100 GPUs at 100 Gbps found strong scaling dropping by up to 9.7x at larger data-parallel degrees [32].
- 8-node H100 fine-tune: an independent single-author Azure test reports 97.3% efficiency at 2 nodes and 90.2% at 8 nodes for a 72B model on 8 x 400 Gb/s InfiniBand; it indicates direction, not an EFA result [33].
The lesson is that completed-job speed can respond to the fabric by a few percent or by a multiple, rising with node count and falling with per-GPU batch size. A 32-node, small-batch FSDP job is a plausible candidate for a 15% gain; a 1-to-8-node job with long sequences and large per-GPU batches is not. MLCommons' MLPerf Training uses the right metric, wall-clock time to a quality target, but publishes no scaling-efficiency percentage and no AWS P5-family H200 result was found [34] [35]. Software tuning alone moved some NVIDIA results by up to 27% in a year, so the stack must be frozen between arms [36].
p5en EFAv3 multi-node training performance: a benchmark protocol
The protocol keeps GPU count, stack, Region, reservation method and acceptance criterion identical and varies only the instance type.
- Verify EFA first: the security group must allow all traffic to and from itself, or NCCL fails [37]; keep all nodes in one Availability Zone because EFA traffic cannot cross zones or VPCs. EFA's transport delivers out of order to avoid head-of-line blocking, which is why collective timing, not packet order, is the metric to read (Source: cdn.amazon.science).
- Run nccl-tests: run all-reduce with the EFA path and confirm NCCL selects the EFA provider; AWS's guide passes the device-RDMA flag [37], which enables the direct GPU-to-NIC path that NVIDIA defines as GPUDirect RDMA [38]. Leave NCCL tuning variables at defaults unless AWS guidance says otherwise [39]; NVIDIA discourages overriding the protocol selection [40]. Record bus bandwidth at 1 GB to 16 GB messages, not an all-sizes mean.
- Run the job at 1, 8 and 32 nodes: same global batch for strong scaling and same per-GPU batch for weak scaling, same checkpoint interval, three repetitions per cell.
- Record per run: step time, GPU busy time, exposed collective time, host data stalls, FSx read time, checkpoint write time, failed or retried steps, and wall-clock time to the quality target. The PyTorch profiler shows device kernel activity and an execution trace, which separates compute kernels from communication gaps [41].
- Report speedup as a ratio of times to target, with median and range, and compare the lower bound against the thresholds in the next section.
FSDP overlap deserves a specific check. PyTorch's FSDP2 runs all-gathers on a separate CUDA stream so the next module's all-gather can overlap the current forward compute [42], yet the first all-gather is exposed [43], and a CPU-bound launch path makes later gathers late [43]. The last point is a host effect, which is the dimension the P5en CPU change addresses. Resharding only within a node trades memory for a smaller backward world [42], a setting that must be identical in both arms.
The checkpoint pattern is where PCIe could matter most. PyTorch's asynchronous checkpointing first copies state to CPU buffers, and its recipe warns that even with pinned memory this device-to-host copy can block the training loop [44]; it also raises CPU memory by a factor tied to checkpoint size per rank and rank count [44], and the recipe recommends one asynchronous request at a time [44]. For the reference 30B job, a full checkpoint of model and optimizer state is roughly 360 to 480 GB (12 to 16 bytes per parameter; the 16-byte upper figure is the ZeRO paper's total, the 12-byte lower figure is a derived estimate) [8]. Scale matters for storage too: Megatron-LM reports a 13.8 TB checkpoint for a trillion-parameter model and checkpoint saves reaching only 40% of peak write bandwidth [45]. On AWS, EFA-enabled FSx for Lustre needs Persistent 2 file systems [46] and supports up to 1200 Gbps per client with GPUDirect Storage [47], so storage settings must match across arms.
- 01Freeze the comparison
Hold the model, parallelism, data, checkpoint interval, stack, Region and acceptance criterion fixed.
- 02Verify the EFA path
Run all-reduce with the EFA path and confirm NCCL selects the EFA provider.
- 03Run matched scaling trials
Benchmark at 1, 8 and 32 nodes with the same checkpoint interval and three repetitions per cell.
- 04Measure time to quality
Record compute, collective, data and checkpoint time, failed or retried steps, and wall-clock time to the quality target.
- 05Apply the purchase threshold
Capture purchase-time quotes and use the lower bound of measured speedup to size the block and decide.
Where the pilot beats the thresholds, P5en is justified by data.
Where the pilot cannot beat the thresholds, P5e is the lower-cost choice.
Data Analysis and Evidence
Threshold table: how fast must P5en be?
Define cost per completed job under time-based billing as rate x nodes x time. If P5en completes work at S times P5e's speed, its time is T / S, and P5en is cheaper when 63.158 x T / S < 54.924 x T, which gives S > 1.1499. Table 3 applies this to the 8-node, 7-day reference worksheet when billing follows elapsed time (On-Demand, or a block that can be shortened in proportion).
| Measured speedup S (P5e time / P5en time) | P5en time for a 168 h P5e job | P5en compute cost | Change versus P5e ($73,817.86) | Verdict on compute cost |
|---|---|---|---|---|
| 1.05 | 160.0 h | $80,842.24 | +$7,024.38 | P5e cheaper |
| 1.10 | 152.7 h | $77,167.59 | +$3,349.74 | P5e cheaper |
| 1.15 | 146.1 h | $73,812.48 | -$5.38 | Break-even |
| 1.25 | 134.4 h | $67,907.48 | -$5,910.37 | P5en cheaper |
| 1.40 | 120.0 h | $60,631.68 | -$13,186.18 | P5en cheaper |
| 1.60 | 105.0 h | $53,052.72 | -$20,765.14 | P5en cheaper |
At the live rates the required speedup is 1.1499, so a measured 15% gain merely pays for the premium. Any smaller figure, including a 35% latency improvement against a different baseline, does not convert to savings unless it produces a 1.15x gain in job completion rate. Because the premium is a ratio, the threshold is the same at 8, 16 or 32 nodes; only the dollar stakes scale (the 32-node, 7-day premium is $44,265.98). A per-node OS fee shifts the threshold slightly: Ubuntu Pro at $0.336 gives (63.158 + 0.336) / (54.924 + 0.336) = 1.149, and RHEL at $1.8432 gives 1.145.
Fixed-block case: reservations are quantized
A prepaid Capacity Block changes the arithmetic. If the same block length must be bought regardless of speed, the full premium ($11,066.50 for 8 nodes and 7 days) is paid and the benefit is saved time, not saved money. If a shorter block can be bought, the saving is bounded by the allowed durations: one-day steps to 14 days, then 7-day steps. Table 4 assumes a job needing exactly 7.0 days of P5e time.
| Speedup S | P5en days needed | Block bought (whole days) | P5en block cost | Versus 7-day P5e block ($73,817.86) |
|---|---|---|---|---|
| 1.05 | 6.67 | 7 | $84,884.35 | +$11,066.50 |
| 1.10 | 6.36 | 7 | $84,884.35 | +$11,066.50 |
| 1.15 | 6.09 | 7 | $84,884.35 | +$11,066.50 |
| 1.167 | 6.00 | 6 | $72,758.02 | -$1,059.84 |
| 1.30 | 5.38 | 6 | $72,758.02 | -$1,059.84 |
| 1.50 | 4.67 | 5 | $60,631.68 | -$13,186.18 |
Rounding up to whole days turns a continuous break-even into a staircase. For a 7-day job the effective threshold is 7/6 = 1.167, and a speedup of 1.15 yields no saving because 6.09 days still requires a 7-day block. The same staircase applies at every duration, and the half hour lost at block end makes thin margins riskier. A buyer should compute days needed from the lower bound of the measured speedup and round up; since blocks cannot be cancelled, an optimistic estimate cannot be corrected after purchase.
Deadline-value sensitivity
Where the reservation is fixed, or the saved time has business value, the question becomes what a day of earlier completion is worth. Table 5 gives the value per day saved that would justify the P5en premium on the 8-node, 7-day fixed block ($11,066.50).
| Speedup S | Days saved on a 7-day job | Break-even value per day saved | Reading |
|---|---|---|---|
| 1.05 | 0.33 | $33,199 | Rarely justified |
| 1.10 | 0.64 | $17,390 | Needs a very costly delay |
| 1.15 | 0.91 | $12,120 | Needs a costly delay |
| 1.25 | 1.40 | $7,905 | Plausible for deadline-bound work |
| 1.40 | 2.00 | $5,533 | Plausible for many programs |
| 1.60 | 2.63 | $4,216 | Usually justified |
The values divide the premium by days saved and have no market data behind them: the decision owner supplies the value of a day, such as the cost of delaying a release or of a team waiting on results. If the saved time can be reused inside the same block for an evaluation sweep, a second experiment or a retry, the value of a day is the value of those node-days, which for 8 nodes at the live P5en rate is $12,126.34 per day.
Cost per token and cost per completed job
Cost per processed token is the node-hour rate divided by tokens per node-hour. (Hypothetical Example) Suppose an 8-node P5e run sustains 60,000 tokens per second in aggregate. Cost per billion tokens is (54.924 x 8) / (60,000 x 3,600) x 10^9 = $2,034. A P5en run at exactly 1.15x (69,000 tokens per second) also costs $2,034 per billion tokens, which restates the break-even in per-token form. These are illustrative arithmetic, not measurements. Cost per completed job is the more honest unit for fine-tuning because it absorbs failed steps, restart-from-checkpoint time and data waits. Operations data show why: Meta reported more than 90% effective training time on 16K GPUs [30], which means up to a tenth of elapsed time went to anything other than useful training. Retry and restart time belong in the denominator.
Bottleneck attribution
Table 6 maps each step-time component to the instance difference that could move it and to the counter that proves it. A speedup that cannot be attributed to a component should be treated as noise or a software difference until reproduced.
| Step-time component | Instance feature that could change it | Counter to record | Expected P5en benefit |
|---|---|---|---|
| GPU busy time (compute) | None, identical H200 GPUs | GPU utilization, achieved MFU; profiler kernel trace [41] | None |
| Exposed collective time (all-gather, reduce-scatter) | EFAv3 latency, 16-card layout; small messages are latency dominated [24] | NCCL kernel time not overlapped; nccl-tests bus bandwidth at 1 to 16 GB [27] | Possible at 8 to 32 nodes with small per-GPU batch |
| Host data stalls (dataloader, tokenization, host-to-device copy) | Sapphire Rapids host, PCIe Gen5 | Dataloader wait time; copy time | Possible if CPU-bound |
| FSx read time | Same file system, EFA client path | Per-client read throughput | Likely none if FSx limited |
| Checkpoint write time | PCIe staging copy, EBS bandwidth | Stage time and write time per interval [44] | Possible for staging; none if FSx limited |
| Failed or retried steps | Not instance-specific | Retry counts, restart time | None expected |
This table implies a diagnostic ordering. If exposed collective time at 32 nodes is below 5% of step time on P5e, no network improvement can deliver 15%, because the maximum gain equals the removable share. If it is 20% or more, a large latency reduction applied to that share could in principle approach the threshold, but it still needs measurement, because the latency claim concerns small messages while large messages are bandwidth bound at equal advertised bandwidth. NVIDIA also notes that GPUDirect RDMA performs best when GPU and NIC share only PCIe switches [38], and NCCL distinguishes NIC placement on the same switch from the same NUMA node, where traffic goes through the CPU [40]; this is why the host topology belongs in the benchmark record.
Implications and Future Directions
Selection rules by bottleneck
- Choose P5e when 1-to-8-node jobs with large per-GPU batches show exposed collective time under about 5% of step time, when the pilot speedup's lower bound is below the threshold for the planned block length, or when the target Region lists only p5e (the live table lists p5e but not p5en in the Phoenix Local Zone, Sydney and Sao Paulo).
- Choose P5en when 32-node sharded jobs show exposed collective time above roughly 15%, when the pilot's lower-bound speedup exceeds the quantized threshold for the planned block length, or when the deadline value per day exceeds the Table 5 break-even.
- Prefer a two-stage plan when uncertain: buy a 1-day, 8-node block of each type, run the protocol, then buy the production block with measured numbers. At live rates those blocks cost $10,545.41 on P5e and $12,126.34 on P5en, so the paired pilot costs $22,671.75, about 30.7% of the 7-day P5e worksheet and roughly twice the 7-day premium. It pays for itself on larger programs, for example at 32 nodes where the 7-day premium alone is $44,265.98.
- Do not mix variables: a different Region, image, NCCL version or checkpoint interval in one arm invalidates the comparison.
Pilot acceptance checklist
- Availability: the chosen zone returns an offering for both types for the needed duration, bearing in mind that only up to six offerings are returned and that offerings are first-come, first-served [12].
- Quote capture: record the purchase-time reservation fee and OS fee for each offering.
- Stack parity: record EFA installer, libfabric, aws-ofi-nccl, NCCL and CUDA versions. The aws-ofi-nccl cheat sheet documents its version floors for p5.48xlarge only, so confirm the current p5en floor with AWS before the pilot [39].
- Reproducibility: three repetitions per cell with a fixed seed policy; report the lower bound of the speedup, not the mean.
- Quality gate: both arms reach the same held-out metric; time to target is the unit.
- Failure accounting: count failed or retried steps and restart cost under the same failure-handling policy.
- Finance sign-off: total cost is reservation fee plus OS fee plus storage and data charges, compared against the threshold tables.
Future directions
Three developments could change the answer. AWS may adjust the 15% ratio at its next scheduled price update in January 2027. Newer accelerator generations may shift the economics of H200 capacity, making wall-clock constraints more important than the node-hour premium. And independent, matched P5e-versus-P5en benchmarks may appear; an arXiv study has already measured point-to-point transfers on 8 x H200 nodes with 2 x 200 Gbps EFA per GPU [48], though not training. Until a matched training study exists, the buyer's own pilot is the only valid evidence. Teams should design the pilot, size the block and interpret the counters against their own workload before committing to a reservation.
Frequently Asked Questions (FAQs)
What is the price difference between P5e and P5en?
On the AWS Capacity Blocks table checked on 2026-10-29, US East (Ohio) lists $54.924 per node-hour for p5e.48xlarge and $63.158 for p5en.48xlarge, an $8.234 or 15.0% premium (Table 2).
What are the aws p5en instance specs compared with P5e?
Both have eight H200 GPUs, 1,128 GB of GPU memory and up to 3,200 Gbps of EFA. P5en changes the host CPU to Intel Sapphire Rapids, uses PCIe Gen5 and third-generation EFA on Nitro v5, and has 100,000 Mbps of EBS bandwidth versus 80,000 Mbps (Table 1).
Does the 35% latency claim mean 35% faster training?
No. AWS compares P5en with P5, not P5e, and the claim concerns latency, not job throughput.
How much faster must P5en be to cost less per completed job?
More than 1.150 times as fast at equal node counts and time-based billing; for a prepaid 7-day block, 1.167 times before a 6-day block can be bought.
Is there a published same-workload benchmark?
As of 2026-10-29 this research found none. The closest evidence is scaling studies on other fabrics and a third-party EFAv3 microbenchmark [18].
Conclusion
P5e and P5en are the same GPU system wrapped in different hosts and fabrics, priced 15.0% apart on AWS's live table. That gap is a clean number and it sets a clean test: P5en earns its premium only if the measured completed-job rate rises by more than 1.15 times, by at least 1.167 times if a 7-day prepaid block is to shrink to 6 days, or if the days saved are worth more than the break-even in the deadline table. AWS's component claims, up to four times CPU-to-GPU bandwidth and up to 35% lower latency against P5, are reasonable grounds to expect gains in communication-bound, host-bound or checkpoint-heavy jobs at 32 nodes. They are not evidence of one, and the 35% figure does not describe P5e.
The practical recommendation is procedural. Freeze the model, parallelism, data, checkpoint interval, stack, Region and acceptance criterion; benchmark at 1, 8 and 32 nodes with the counters in the attribution table; capture purchase-time quotes; and decide with the lower bound of the measured speedup. Where the pilot cannot beat the thresholds, P5e is the lower-cost choice; where it does, P5en is justified by data rather than by a network headline.
External Sources (48)
About
GPUSmith
Plan and build private AI compute with GPU Smith. We connect workload requirements with GPU hardware, networking, deployment and operating decisions so your infrastructure fits the work it must perform.
GPU Smith provides independent engineering and research for private AI infrastructure. We help technical buyers and operators reason about GPU workload sizing, hardware selection, procurement, deployment and inference operations, from the compute system to the networking, power and cooling requirements around it.
Start with the workload
Useful infrastructure decisions begin with the models, data, throughput, latency and operating constraints a team actually has. GPU Smith helps connect those requirements with system design and deployment choices. The goal is a privately controlled AI environment whose capacity and operational demands are understood before a purchasing decision.
Hardware and supplier research
Our public reference library covers GPUs, complete systems and networking components. The server-vendor directory and manufacturing research help teams investigate suppliers, compare options and follow sources behind technical claims. We distinguish manufacturer specifications from measured benchmarks and advertised capabilities from tested configurations. Reference pages are research resources, not a live inventory listing or a binding equipment quote.
Deployment and operations
GPU Smith's engineering scope includes infrastructure integration, networking, power, cooling and the practical operation of inference workloads. Our published articles explain the tradeoffs behind deployment, procurement and ongoing operations so teams can ask better questions and document decisions.
Work with GPU Smith
Explore the hardware library, GPU references, networking references and vendor research. Contact GPU Smith with your workloads and deployment constraints to discuss a project and confirm current scope, pricing and availability.
Inclusion of a manufacturer or product in our research does not imply a partnership, certification or endorsement.
Disclaimer
This document is provided for informational purposes only. No representations or warranties are made regarding the accuracy, completeness, or reliability of its contents. Any use of this information is at your own risk. GPUSmith shall not be liable for any damages arising from the use of this document. This content was generated with assistance from artificial intelligence tools, which may contain errors or inaccuracies. Readers should verify critical information independently. All product names, trademarks, and registered trademarks mentioned are property of their respective owners and are used for identification purposes only. Use of these names does not imply endorsement. This document does not constitute professional or legal advice. For specific guidance related to your needs, please consult qualified professionals.