GPUSmith Article
Data Center Electrical Design for GPU Clusters Explained
Inside this article
- 01Executive Summary
- 02Introduction and Background
- 03GPU Cluster Power Requirements and Rack Density
- 04Utility Power Planning and Grid Interconnection for AI Data Centers
- 05UPS Sizing, Generator Backup, and Redundancy Topology
- 06Data Center Power Redundancy Tiers: N+1, 2N and 2N+1 Compared
- 07Electrical Infrastructure Design: From Utility to Rack
- 08Data Analysis and Evidence
- 09Case Studies and Real-World Examples
- 10Implications and Future Directions
- 11Frequently Asked Questions (FAQs)
- 12Conclusion
Based on my review, only the "Own vs Rent GPUs" TCO article has genuine topical overlap with this power-infrastructure piece (via cost-of-ownership and buildout-investment framing); the H100/H200 rental pricing article has no natural anchor in this content, so I'm not forcing a link to it.
Executive Summary
Graphics processing unit (GPU) clusters built for artificial intelligence (AI) training and inference have overturned the assumptions that governed data center electrical design for two decades. A single NVIDIA GB200 NVL72 rack draws a nominal 120 kW, with production deployments measured at 132 kW sustained [1], while Microsoft's Fairwater superfactory racks reach roughly 140 kW per rack and 1,360 kW per row [2] ([2]. Most legacy facilities were engineered for 10 to 30 kW per rack [1], and Uptime Institute's 2025 global survey confirms that facilities in the 10 to 30 kW range remain the norm even as extreme densities emerge [3]. This report explains, for the audience of engineers, capacity planners and infrastructure investors evaluating GPU-cluster buildouts as of July 2026, how utility interconnection, medium-voltage distribution, transformers, uninterruptible power supply (UPS) systems, generator backup and redundancy topology must be redesigned to support this step change in density.
The core technical finding is that rack power density has roughly quadrupled to sextupled in three years, and vendor reference designs now plan explicitly for 500 kW per rack in the near future [4] and up to 1 MW per deployment by 2027 [5]. NVIDIA's response is an architectural shift to 800 volt direct current (VDC) distribution designed to support 1 MW racks starting in 2027, promising up to 5% better end-to-end efficiency and 30% lower total cost of ownership [6].
Redundancy engineering has also had to change. Traditional 2N architecture, in which every UPS and distribution path is fully duplicated, cannot economically scale to gigawatt-class AI campuses, so NVIDIA's own DGX SuperPOD design guides now specify a minimum of three discrete power paths per rack rather than the classic two, each sized to carry 50% of peak load, which the company terms "Enhanced N+1" [7]. At the other extreme, Microsoft has begun forgoing on-site UPS and generation entirely at some Fairwater sites, betting instead on utility feeds rated for "4x9" (99.99%) availability at "3x9" cost [2]. Vertiv's 007A reference design for a 6,200 kW GB200 NVL72 campus instead uses full 2N UPS redundancy across five 1.2 MW SuperPODs [4], and Schneider Electric's Reference Design 110 sizes a 7,536 kW GB300 NVL72 facility to Uptime Institute's Tier III standard with racks up to 142 kW [8]. Uptime Institute's tier system still governs the redundancy vocabulary of the industry: Tier III requires N+1 redundancy and concurrent maintainability, while Tier IV requires 2N (or 2N+1) fault tolerance across independent, physically isolated distribution paths [9] [10].
Beyond the rack, the constraint has shifted from capital to grid access. Global electricity consumption by data centers stood at approximately 415 terawatt-hours (TWh) in 2024 and the International Energy Agency (IEA) projects it will roughly double to 945 TWh by 2030 [11]. More than 2,500 gigawatts (GW) of generation, storage and large-load projects, including data centers, sit stalled in global grid interconnection queues [12], and in Texas alone the grid operator ERCOT tracks over 438 GW of large-load interconnection requests, nearly 90% of which come from data centers [12]. This scarcity has pushed operators toward on-site natural gas turbines, diesel generation and, increasingly, battery energy storage systems (BESS) as substitutes for or supplements to conventional utility-plus-UPS designs. U.S. diesel generator capacity dedicated to data centers nearly tripled from 20 GW in 2018 to 55 GW in 2024 [13], and Uptime Institute's 2026 outage analysis finds that power remains the leading cause of impactful data center outages, with UPS, transfer switch and generator failures dominant [14].Together, these findings show that data center electrical design for GPU clusters in 2026 is no longer primarily an engineering exercise inside the fence line; it is a joint capital, siting and utility-negotiation problem in which rack-level busway and switchgear decisions are downstream of interconnection queue position.
Introduction and Background
Data center electrical design for GPU clusters refers to the end-to-end engineering of power delivery, from the utility interconnection and medium-voltage switchgear through step-down transformers, UPS systems, generator backup, and finally the rack power distribution units (rPDUs) and busways that feed individual GPU servers. Historically, enterprise and hyperscale data centers were designed around a relatively narrow density band. As recently as 2025, Uptime Institute's global survey found that racks in the 10 to 30 kW range remained the most common deployment, with extreme densities still rare [3]. The arrival of GPU-dense accelerated computing racks, principally NVIDIA's DGX SuperPOD, GB200 NVL72 and GB300 NVL72 platforms, has broken that assumption within a single hardware generation.
The core technical driver is simple: modern large language model (LLM) training and inference workloads are best served by tightly coupled GPU domains that communicate over very low latency interconnects such as NVIDIA's NVLink, which requires packing dozens of GPUs into a single rack rather than spreading them across a row. The GB200 NVL72 connects 36 Grace CPUs and 72 Blackwell GPUs into a single rack-scale, liquid-cooled unit that behaves as one large accelerator with 130 terabytes per second (TB/s) of GPU-to-GPU bandwidth [15]. That density comes at an electrical cost that legacy facilities were never engineered to carry: an industry practitioner writing on the r/datacenter community forum in 2026 observed that a GB200 NVL72 rack running at 132 kW sustained requires 3 to 4 parallel electrical feeds where a standard 225-amp busway, designed for roughly 40 kW per tap, previously sufficed for an entire row [1].
This report examines how electrical designers, facility operators and capacity planners are responding across the full power chain: from utility-scale interconnection and on-site generation, through medium-voltage and low-voltage distribution, UPS and battery architecture, to rack-level busway and phase-balancing schemes. It also surveys the redundancy vocabulary, N, N+1, 2N and 2N+1, as it is being reinterpreted for gigawatt-class AI campuses, where the classic "duplicate everything" 2N philosophy increasingly competes with utility-diversity strategies that trade on-site backup infrastructure for grid reliability. The analysis draws on primary vendor reference designs from NVIDIA, Schneider Electric and Vertiv, peer-reviewed and preprint engineering literature including a 2026 Microsoft Azure Research paper on power delivery hierarchies, standards bodies including the Uptime Institute, ASHRAE and the National Fire Protection Association (NFPA), and named case studies from OpenAI's Stargate, Microsoft's Fairwater, and xAI's Colossus campuses, to give infrastructure decision-makers a quantified, source-verified picture of what GPU-cluster electrical design requires as of mid-2026.
GPU Cluster Power Requirements and Rack Density
The starting point for any electrical design exercise is the power draw of the compute hardware itself, and that figure has moved sharply upward across successive NVIDIA GPU generations. The DGX H100 generation, NVIDIA's design guide notes, was "typically deployed with a rack density of four DGX H100 systems per rack," using 200 to 240 volt alternating current (VAC) power supplies and yielding roughly 13.7 kW per circuit at 230V single-phase, 63A [7]. The subsequent GB200 NVL72 generation abandoned that per-server model in favor of a rack-scale architecture: NVIDIA states a nominal specification of 120 kW for a full rack, or about 1.2 kW per GPU [16], while field reports from production deployments put sustained draw at 132 kW [1]. Microsoft's own Fairwater deployments, which run GB200 and GB300 GPUs, report approximately 140 kW per rack and 1,360 kW per row [2].
Vendor reference architectures push this further. Schneider Electric's EcoStruxure Reference Design 110, built for GB300 NVL72 clusters, specifies AI racks up to 142 kW within a 7,536 kW total data center IT capacity across 96 racks [8]. Vertiv's AI Reference Design 007A, sized for 6,200 kW of IT load across five 1.2 MW DGX SuperPODs, lists 80 racks at 73 kW alongside 30 lower-density support racks, and explicitly instructs designers to "design for the future" toward 500 kW per rack [4]. Looking further out, a 2026 Stanford and Microsoft Azure Research paper on power delivery hierarchy design projects rack power "approaching 1MW per deployment by 2027" [5], a trajectory NVIDIA itself corroborates by targeting 1 MW IT racks for its next-generation 800 VDC architecture beginning in 2027 [6].
This step change matters physically, not just electrically. The same practitioner analysis of 132 kW racks notes that full NVL72 configurations exceed 250 pounds per square foot in floor loading, against a standard raised-floor rating of 150 to 250 pounds per square foot, meaning many existing raised floors require structural assessment before a GPU rack can be placed [1]. Both power density and its physical corollaries, floor loading, busway ampacity and cooling capacity, must therefore be co-designed rather than treated as sequential engineering steps.
- Legacy baseline: 10 to 30 kW per rack, still the most common density band industry-wide as of the 2025 Uptime Institute survey [3].
- Current-generation GPU racks: 120 to 142 kW per rack for GB200/GB300 NVL72 deployments [16] [8].
- Near-term roadmap: 500 kW per rack per vendor planning guidance, with 1 MW racks targeted for 2027 [4] [6].
- Physical corollaries: structural floor loading above 250 lb/sq ft and busway ampacity beyond 225A standard ratings must be re-engineered together with power [1].
Utility Power Planning and Grid Interconnection for AI Data Centers
Because GPU cluster campuses now routinely require hundreds of megawatts to multiple gigawatts of firm capacity, utility interconnection has become the binding constraint on data center electrical design, ahead of on-site equipment selection. Global electricity demand from data centers was approximately 415 TWh in 2024, about 1.5% of global electricity consumption, and has been growing at 12% per year over the preceding five years [11]. The IEA's base case projects this will roughly double to 945 TWh by 2030, just under 3% of global electricity consumption, with electricity use in AI-accelerated servers growing around 30% annually, more than four times faster than growth in electricity demand from all other economic sectors combined [11]. In the United States specifically, the nonprofit Better Data Center Project reports data center electricity consumption nearly tripled from 76 TWh in 2018 to approximately 200 TWh in 2024 [17].
Grid capacity to serve this growth is scarce. As of mid-2026, more than 2,500 GW of generation, storage and large-load projects, data centers prominent among them, remain stalled in interconnection queues worldwide, a figure sourced to IEA analysis and highlighted in the World Economic Forum's Energy Transition Index 2026 [12]. Texas offers the clearest regional signal: ERCOT tracks over 438 GW of large-load interconnection requests, nearly 90% of which originate from data centers, and the grid operator introduced a "Batch Zero" process in 2026 to separate mature projects from speculative ones, with the first realistic transmission plan not expected until fall 2027 [12]. Federal regulators are also intervening: the Federal Energy Regulatory Commission's June 2026 show-cause orders require grid operators to justify or revise how they treat large loads above 50 MW in study processes, cost allocation and co-location arrangements [12].
The practical response from hyperscalers has been to bypass the queue with direct generation deals. Microsoft has structured a 20-year agreement supporting the restart of a nuclear generating unit targeted for 2028, Google has committed to multiple small modular reactors aiming for first power around 2030, and Amazon has arranged dedicated gas-fired supply through a long-term structure ramping toward 2.67 GW [12]. OpenAI's Stargate program illustrates the same pattern at the site level: across seven US locations, the flagship Abilene, Texas campus was powered at an estimated 0.3 GW as of early 2026 by "a mix of on-site natural gas and grid power," with a projected buildout to 1.2 GW [18], while the Shackelford County, Texas site is planned to run on an onsite natural gas microgrid supplying up to 2 GW [18], and the Doña Ana County, New Mexico site is designed around two natural gas microgrids intended to limit impact on the local grid [18]. Across all seven Stargate sites, planned capacity exceeds 9 GW, roughly the peak power demand of New York City [18]. Other operators, such as Vantage's Port Washington, Wisconsin Stargate site, target a mixed profile with 70% of power drawn from solar, wind and battery storage [18].
An alternative strategy avoids the co-generation route entirely by shopping for grid capacity rather than building it. Microsoft describes selecting its Atlanta Fairwater site specifically "with resilient utility power in mind," targeting "4x9" (99.99%) availability at "3x9" cost, which allows the company to forgo on-site generation, UPS systems and dual-corded distribution for the GPU fleet [2]. This represents a fundamentally different design philosophy from the traditional utility-plus-redundant-backup model, discussed further in the redundancy section below.
UPS Sizing, Generator Backup, and Redundancy Topology
Sizing the uninterruptible power supply chain for a GPU cluster begins with the same fundamentals used in any critical facility, but the scale and non-linear character of AI load make the calculation less forgiving. A UPS is rated in kilovolt-amperes (kVA), the apparent power it can deliver, and Legrand's technical guide recommends starting from total connected load, then applying a 20% to 25% capacity buffer for headroom and future expansion before rounding up to the nearest standard UPS size [19]. Because older UPS systems commonly operate at a power factor of 0.8, a 100 kVA unit may deliver only 80 kW of real power, while modern platforms rated at power factor 1.0 deliver the full 100 kW, a distinction that can change required kVA by 20% to 25% for an equivalent real-power load [19]. Upstream of the UPS, transformer sizing must add another 5% to 15% overhead above IT load for UPS and distribution losses, according to an electrical engineering reference guide, plus additional derating of 10% to 15% for the harmonic distortion that double-conversion UPS rectifiers impose on the supply transformer [20].
Redundancy adds a further, and frequently misapplied, layer of sizing logic. For an N+1 configuration, "each transformer must be able to supply the entire load when the other is off," so per-unit nameplate capacity should equal the full required load, not the load divided by the number of units; the same guide flags "dividing load by two for N+1" as the single most common data center transformer sizing mistake [20]. In a worked example for a 500 kW critical IT load with N+1 transformers, applying UPS overhead, cooling load, a 25% safety margin and harmonic derating raises the minimum per-transformer nameplate rating to roughly 1,080 kVA, meaning the designer must select a 1,250 kVA unit rather than the seemingly adequate 1,000 kVA size [20]. A GPU power calculator that applies N, N+1 or 2N redundancy and PUE shows how these choices change the number of GPU nodes a fixed site can run.
Generator backup follows a parallel but distinct logic, sized for extended outage duration rather than instantaneous ride-through. Uptime Institute's Tier I baseline already requires "an engine generator for power outages" alongside UPS [9], and Tier III designs typically specify at least 12 hours of on-site fuel storage with rapid start-up capability, according to trade press analysis of the standard [21]. Diesel remains the dominant technology because of its energy density: generators can run for up to 96 hours using fuel stored on site [13] and because they carry lower upfront capital cost, roughly $1,000 per kilowatt versus about $1,300 per kilowatt for a four-hour battery storage system as of June 2025 National Renewable Energy Laboratory estimates [13]. Large sites typically deploy hundreds of generators in the 2 to 4 MW size range; an Amazon data center in Manassas, Virginia, for instance, uses 93 generators of 2.5 MW each [13].
At the rack level, GPU cluster power provisioning breaks from the traditional dual-feed model. NVIDIA's DGX SuperPOD electrical design guide specifies that "the preferred power for high-density deployment patterns is 415 VAC, 32A, three-phase, N+1" [7], and because a single node failure can stop an entire multi-node AI training job, the design guide requires a minimum of three power sources per rack, each sized to carry 50% of peak load, so that any single source failure leaves at least four of six power supplies energized [7]. NVIDIA distinguishes three provisioning patterns, and grades "traditional redundant power" (two utility feeds or two UPS units) as "not acceptable for DGX H100 systems," while its "N+1" and "Enhanced N+1" schemes, which use three UPS-fed paths, are rated as acceptable to good [7]. Management racks, by contrast, can still use traditional 2N redundancy, since their loss does not halt a distributed training job [7].
Data Center Power Redundancy Tiers: N+1, 2N and 2N+1 Compared
Uptime Institute's four-tier classification system remains the reference framework for describing data center power and cooling redundancy, and it predates the AI era by three decades, having been created "over 30 years ago" as the industry's benchmark [9]. Tier I provides a single path for power and cooling with no redundant components; Tier II adds redundant capacity components such as generators and UPS modules but keeps a single distribution path; Tier III requires full N+1 redundancy across all systems, including distribution paths, enabling maintenance without taking the facility offline; and Tier IV requires 2N+1 redundancy, with independently active, physically isolated systems that can sustain any single failure without impacting load [10]. Uptime Institute's own site language describes Tier III as "concurrently maintainable with redundant components as a key differentiator," where "any part can be shut down without impacting IT operation" [9], and Tier IV as adding "fault tolerance to the Tier III topology," such that "when a piece of equipment fails, or there is an interruption in the distribution path, IT operations will not be affected" [9]. Wikipedia's summary table, cross-checked against the Uptime Institute standard, associates each tier with a modeled uptime guarantee: 99.671% for Tier I (up to 28.8 hours of annual downtime), 99.741% for Tier II, 99.982% for Tier III (under 1.6 hours), and 99.995% for Tier IV (under 26.3 minutes) [10].
The redundancy vocabulary itself, N, N+1, N+2, 2N and 2N+1, describes distinct capacity and topology strategies rather than a single sliding scale. CoreSite's engineering explainer defines N as "the minimum capacity needed to power or cool a data center at full IT load," with no tolerance for any disruption [22]. N+1 adds a single extra component, for example a fifth UPS unit where four are required for full load, following a design convention of one additional component for every four required [22]. 2N duplicates the entire architecture, doubling UPS, generator and distribution paths, so that a full independent architecture can carry the entire load if the primary fails [22]. 2N+1 layers an additional component on top of full 2N duplication, providing the deepest protection typically deployed commercially, reserved for organizations that "cannot tolerate even minor service disruptions" [22]. Importantly, redundancy is not necessarily uniform within a single facility: CoreSite notes that "a given data center can operate with multiple redundancy models," for example a 2N UPS paired with an N+1 cooling plant, though all power whips must be 2N to avoid defeating upstream UPS redundancy with a single-corded load [22].
Table 1 below compares the four Uptime Institute tiers against representative GPU-cluster reference designs surveyed in this report, illustrating how vendor architectures map onto (and sometimes diverge from) the formal tier system.
| Tier / Design | Redundancy Model | Concurrent Maintainability | Modeled Availability | Representative GPU-Cluster Example |
|---|---|---|---|---|
| Tier I | N, no redundancy | No | 99.671% (<28.8 hrs/yr downtime) [10] | Rare for production AI clusters; used for development/test capacity only |
| Tier II | Partial N+1 | No, single distribution path [10] | 99.741% (<22 hrs/yr) [10] | Uncommon for hyperscale AI; occasionally used at edge inference sites |
| Tier III | Full N+1, all systems | Yes [9] | 99.982% (<1.6 hrs/yr) [10] | Schneider Electric RD110: 7,536 kW, Tier III target, racks up to 142 kW [8] |
| Tier IV | 2N or 2N+1, all systems | Yes, fault tolerant [9] | 99.995% (<26.3 min/yr) [10] | Vertiv 007A: 7.5 MW capacity, full 2N UPS redundancy, 6,200 kW IT load [4] |
| NVIDIA Enhanced N+1 (rack level) | Three discrete power paths, each 50% of peak load | Yes, for rack-level events | Not tier-certified; a rack-level design pattern layered atop facility Tier III/IV infrastructure | NVIDIA DGX SuperPOD: minimum three power sources per rack [7] |
| Utility-diversity model | Single high-reliability utility feed, minimal on-site backup | Not applicable in the traditional sense | Targeted "4x9" (99.99%) at "3x9" cost [2] | Microsoft Fairwater Atlanta: forgoes on-site generation, UPS, dual-corded distribution [2] |
The table shows a bifurcation in current GPU-cluster design philosophy that the formal tier system does not fully capture. Vertiv's and Schneider Electric's reference designs work within the established Tier III/Tier IV framework, layering NVIDIA's rack-level three-path Enhanced N+1 scheme on top of facility-level N+1 or 2N infrastructure. Microsoft's Fairwater approach instead substitutes utility-grade reliability for on-site redundancy hardware, a strategy only viable where the site was specifically selected for resilient grid supply and where the operator accepts a different risk and cost profile than a formally tier-certified facility would carry. Both approaches respond to the same underlying pressure, the capital and land cost of duplicating multi-hundred-megawatt electrical infrastructure at 2N ratios, but they resolve it in opposite directions: one doubles down on on-site redundancy engineering, and the other trades it for grid selection and financial risk transfer.
Electrical Infrastructure Design: From Utility to Rack
A complete GPU-cluster electrical design proceeds through a defined hierarchy, each stage governed by distinct standards and equipment classes. At the top of the chain, medium-voltage (MV) switchgear, rated broadly across 3 kV to 36 kV [23], receives utility supply and distributes it to on-site transformers. Metal-clad switchgear, defined by the IEEE C37.20.2 standard, encloses incoming bus, outgoing bus, instrumentation and the main circuit breaker in separate metal compartments and is rated from 5 kV to 38 kV, offering draw-out circuit breakers that simplify maintenance in industrial and power-generation settings, including large data center campuses [24]. NVIDIA's own 800 VDC roadmap begins at the same layer, converting 13.8 kV AC grid power directly to 800 VDC at the data center perimeter using industrial-grade rectifiers, which the company argues eliminates "most intermediate conversion steps" and the associated energy losses [6].
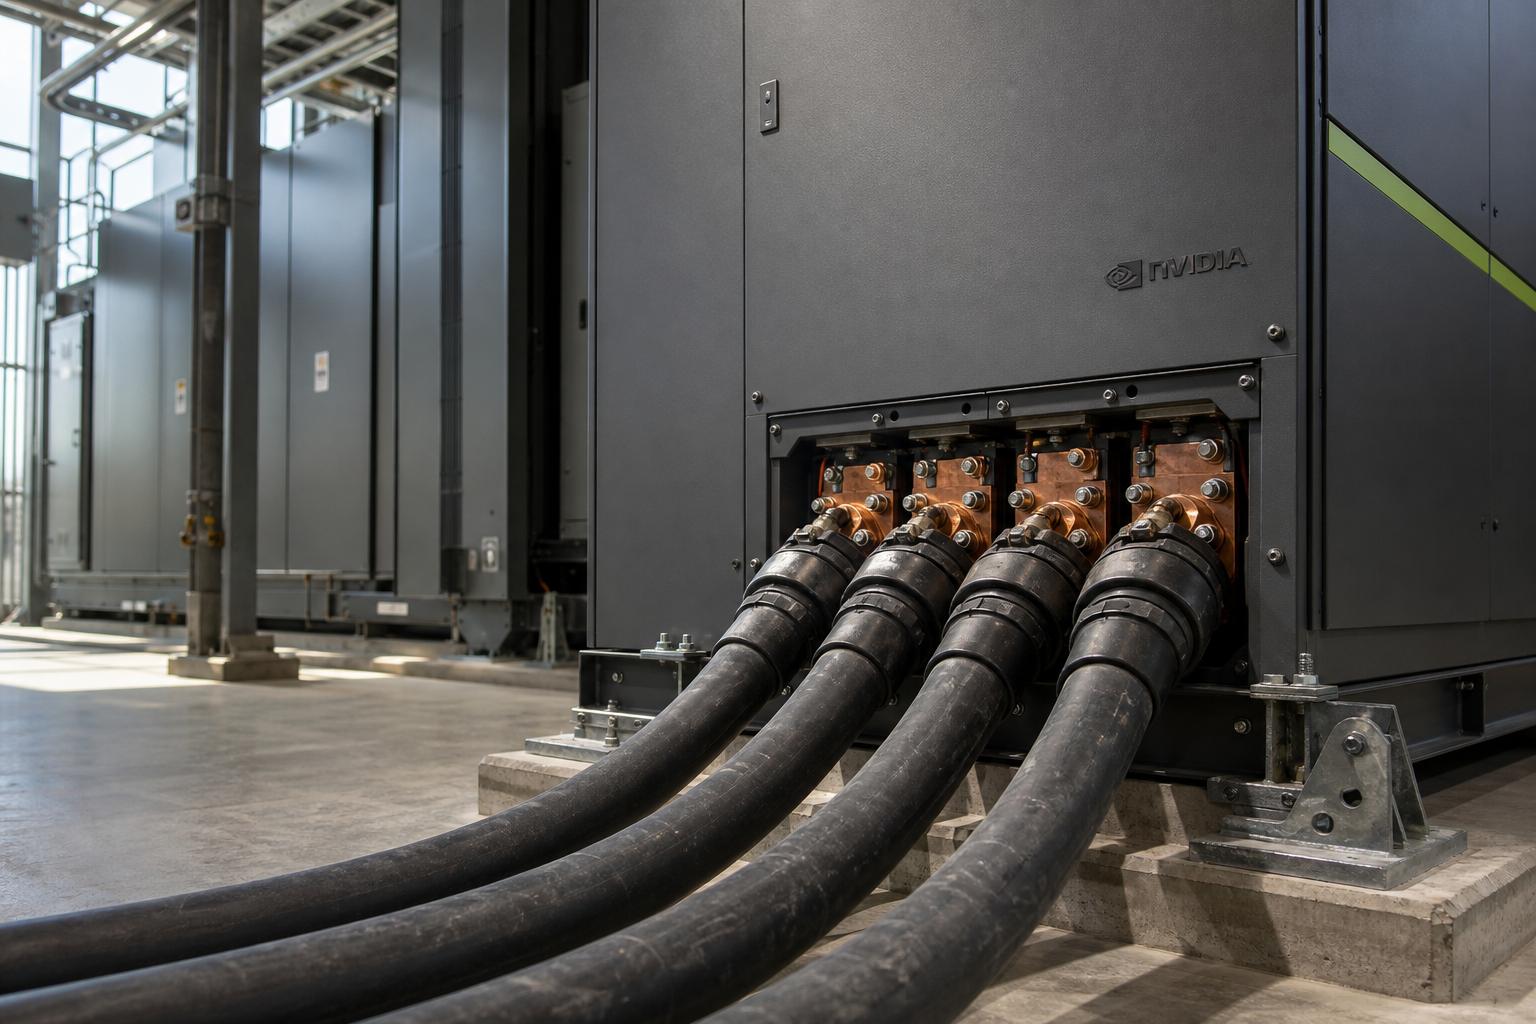
Downstream, step-down transformers convert MV supply to the low-voltage (typically 400V to 480V) levels used by UPS systems and rack-level power distribution units. The physical limits of conventional 54 VDC in-rack distribution are becoming a binding constraint at these densities: NVIDIA states that a single 1 MW rack using 54 VDC distribution would require up to 200 kilograms of copper busbar, and that the aggregate busbar copper across a 1 GW data center could reach 200,000 kilograms [6], a scale the company calls unsustainable for a gigawatt-class facility. This is the direct technical justification for the industry's shift toward 800 VDC distribution, which NVIDIA is developing jointly with silicon providers including Analog Devices, Infineon and Texas Instruments and power system vendors including Eaton, Schneider Electric and Vertiv [6].
At the rack level, NVIDIA's electrical design guide sets out common distribution schemes matched to DGX rack densities, with 415 VAC, three-phase, 32A circuits as the preferred high-density pattern [7], while phase balancing across paired racks is required to prevent uneven loading of the three-phase supply, with the design guide noting that "it takes two racks of systems to balance the phases while maintaining the availability and performance characteristics of the N+1 design" [7]. All of this construction operates under the framework of NFPA 70, the National Electrical Code (NEC), described by the National Fire Protection Association as "the benchmark for safe electrical design, installation, and inspection" and enforced in some form across all 50 US states, with a new edition released every three years, most recently the 2026 edition [25].
- Utility interconnection: 13.8 kV or higher MV service, negotiated against interconnection-queue position rather than pure engineering lead time [6] [12].
- Medium-voltage switchgear: metal-clad, IEEE C37.20.2, 5 to 38 kV rated, draw-out breakers for maintainability [24].
- Step-down transformers: sized for IT load plus 5 to 15% UPS/distribution overhead and 10 to 15% harmonic derating, with N+1 units each rated for full load [20].
- UPS and battery plant: sized with 20 to 25% buffer above connected load, power-factor corrected, N+1 or 2N depending on tier target [19].
- Rack distribution: 415 VAC three-phase circuits or emerging 800 VDC busway, phase-balanced across paired racks [7].
- Governing code: NFPA 70 (NEC), 2026 edition, enforced in all 50 US states, revised on a three-year cycle [25].
Data Analysis and Evidence
Quantifying the scale of the GPU-cluster electrical design challenge requires triangulating hardware, grid and reliability data, because no single dataset covers the full chain from silicon to substation. On the hardware side, per-GPU power draw has increased substantially across generations, and rack-level density figures gathered in this report, spanning roughly 73 kW to 142 kW in current production reference designs [4] [8], with vendor roadmap targets of 500 kW to 1 MW within the 2027 to 2028 window [4] [5], together imply the electrical infrastructure ratio between legacy and next-generation facilities will widen from roughly 5x today (30 kW versus 142 kW) to over 30x within two years (30 kW versus 1 MW). This is not a linear scaling problem; it changes the physics of busway ampacity, copper mass and cooling coupling simultaneously, as the 800 VDC copper calculations above demonstrate [6].
At the grid level, the 2026 IEA figures show data center electricity consumption growing from 415 TWh (2024) to a projected 945 TWh (2030), with accelerated (AI) servers responsible for almost half of that net increase despite conventional servers still accounting for a larger installed base [11]. Within a modern hyperscale data center, the IEA further breaks down electricity demand by component: servers account for around 60% of consumption, storage systems around 5%, networking equipment up to 5%, and cooling as little as 7% in efficient hyperscale facilities but over 30% in less efficient enterprise sites [11]. Power usage effectiveness (PUE), the ratio of total facility energy to IT equipment energy, remains stubbornly flat industry-wide at an average of 1.54 to 1.56, according to Statista's tabulation of Uptime Institute survey data across 2024 and 2025, despite six consecutive years of limited improvement attributed to legacy infrastructure and climate-specific cooling limitations [26] [3]. Purpose-built GPU cluster reference designs, by contrast, report substantially better annualized PUE: Schneider Electric's RD110 design targets 1.09 in Paris and 1.16 in Singapore at 100% load [8], illustrating the efficiency dividend of purpose-built liquid-cooled AI facilities over the broader industry average.
On reliability, Uptime Institute's 8th Annual Outage Analysis (2026) reports that power remains the single leading cause of impactful outages, with UPS, transfer switch and generator failures dominant, even as overall outage frequency per site has declined for a fifth consecutive year [14]. Financially, 57% of respondents to Uptime's 2025 survey reported their most recent major outage cost more than $100,000, and for a second consecutive year, 1 in 5 reported costs exceeding $1 million [14]. Uptime's survey methodology, based on responses from more than 800 data center owners and operators collected online and via email from April to May 2025, gives the reliability figures a broad and repeatable sample base [3].
A 2026 peer-reviewed-track engineering paper from Stanford University and Microsoft Azure Research, validated against six years of real operational data from 18 Azure data centers, quantifies a related and less obvious cost driver: "stranded capacity," provisioned power that a facility cannot actually deploy because some other constraint, cooling, floor space or a specific UPS domain, binds first [5]. The paper finds that two power delivery designs with similar provisioned capacity can differ by more than 20x in throughput per watt and more than 20% in cost per watt, and that a modestly cheaper design (a "3+1" distributed-redundant topology costing about 3% more per provisioned megawatt than an alternative) can require 23 additional data halls and see its cost gap nearly double, to 5.8%, over an eight-year fleet lifecycle once stranding effects compound [5]. The paper's central methodological claim, that "the relevant planning objective is not installed megawatts, but deployable capacity over time," is a useful corrective for capacity planners who benchmark designs purely on nameplate provisioned power [5].
Table 2 below assembles the campus-scale power figures gathered across the named case studies in this report, giving planners a comparative sense of how power capacity, redundancy strategy and generation source vary across current GPU-cluster projects.
| Campus | Reported / Projected Capacity | Primary Power Source | Redundancy or Design Notes |
|---|---|---|---|
| OpenAI Stargate, Abilene, TX | 0.3 GW current, 1.2 GW projected [18] | On-site natural gas plus grid power, including local wind [18] | Built by Crusoe; four of eight buildings operational as of early 2026 [18] |
| OpenAI Stargate, Shackelford County, TX | 0 GW current, 2 GW projected [18] | Onsite natural gas microgrid [18] | 10 buildings planned; projected completion Q4 2028 [18] |
| Microsoft Fairwater, Atlanta, GA | Not separately disclosed as a discrete figure | Utility grid, selected for high reliability [2] | Forgoes on-site generation, UPS and dual-corded distribution [2]; ~140 kW/rack, 1,360 kW/row [2] |
| xAI Colossus 1, Memphis, TN | 150 MW at full capacity [27] | On-site methane gas turbines plus grid | 12 permitted turbines operating as of January 2026, after regulatory dispute over unpermitted units [27] |
| Schneider Electric RD110 (GB300 NVL72 reference) | 7,536 kW IT capacity [8] | Reference design, not site-specific | Tier III target, N+1 concurrent maintainability, 400V/50Hz [8] |
| Vertiv 007A (GB200 NVL72 reference) | 7.5 MW solution capacity, 6,200 kW IT load [4] | Reference design, not site-specific | 2N redundancy across five 1.2 MW DGX SuperPODs [4] |
As the table shows, capacity figures across current GPU-cluster projects span three orders of magnitude, from single-digit-megawatt reference pods to multi-gigawatt hyperscale campuses, and the choice of power source correlates closely with redundancy philosophy: sites built around dedicated on-site gas generation (Stargate Shackelford, Colossus) tend to pair that generation with the facility's own redundancy engineering, while sites built around purchased utility capacity (Fairwater Atlanta) shift redundancy responsibility upstream to the grid operator's reliability guarantee. Neither approach is universally cheaper; the Stanford/Microsoft paper's stranding analysis suggests the economically optimal choice depends on multi-year deployment trajectory and placement policy as much as on nameplate capacity or provisioning cost per megawatt [5].
Case Studies and Real-World Examples
OpenAI Stargate, Abilene, Texas
The Abilene, Texas site is the most complete of OpenAI's seven Stargate locations and illustrates the hybrid on-site-generation-plus-grid model now common for large AI campuses. Built by AI infrastructure developer Crusoe, the site was operating at an estimated 0.3 GW as of early 2026, with four of eight planned buildings already active and housing NVIDIA Blackwell chips [18]. Power is supplied through "a mix of on-site natural gas and grid power, which includes local wind power" [18]. OpenAI originally planned to expand the site to 2.1 GW but reversed course in March 2026, redirecting that planned capacity to other Stargate locations; Microsoft has since partnered with Crusoe on an adjacent 900 MW site [18]. The site's revised trajectory shows how grid access and partner reallocation, not just construction pace, now drive campus-level capacity decisions.
Microsoft Fairwater, Atlanta, Georgia and Wisconsin
Microsoft's Fairwater campuses represent the clearest embodiment of the utility-diversity design philosophy discussed earlier in this report. The Atlanta site, unveiled as the second Fairwater location and directly networked to the first Fairwater site in Wisconsin, was "selected with resilient utility power in mind" to achieve "4x9" (99.99%) availability at "3x9" cost, allowing Microsoft to "forgo traditional resiliency approaches for the GPU fleet (such as on-site generation, UPS systems and dual-corded distribution)" [2]. Instead, Microsoft has developed software-driven and hardware-driven solutions, including "an on-site energy storage solution to further mask power fluctuations without utilizing excess power," to manage the power oscillations that large synchronized GPU training jobs create [2]. Rack and row-level power reaches approximately 140 kW and 1,360 kW respectively [2], and the design uses a two-story networking architecture unlike most traditional single-story cloud data centers [2] to pack more GPUs per unit of land.
xAI Colossus, Memphis, Tennessee, and Southaven, Mississippi
xAI's Colossus campuses illustrate the regulatory friction that can accompany on-site gas generation strategies. At full capacity, Colossus 1 in Memphis uses 150 megawatts of electricity, described by the Guardian as enough to power roughly 100,000 homes, and the site was built in just 122 days during summer 2024, a record pace [27]. To meet that demand quickly, xAI deployed up to 35 portable methane gas turbines under a local permitting loophole exempting generators used for fewer than 364 consecutive days; in January 2026, the US Environmental Protection Agency (EPA) ruled that such portable turbines require air quality permits regardless of duration of use, and xAI now operates 12 permitted turbines at Colossus 1 after receiving permits for 15 [27]. A second campus, Colossus 2 in Southaven, Mississippi, uses 59 generators, of which 18 lacked air quality permits as of late 2025 according to Mississippi Today reporting cited by the Guardian [27], and a third Southaven-area facility, nicknamed "MACROHARDRR" by Elon Musk, is being built to require nearly 2 GW of computing power [27]. The Colossus case demonstrates that speed-to-power strategies built on distributed gas turbines carry compliance risk that purely grid-fed or long-term permitted generation avoids.
Virginia Data Center Corridor: Diesel Backup at Regional Scale
Virginia, described as the largest data center market globally and host to "more than a third of all hyperscale data centers worldwide," provides the clearest regional case of how backup generator capacity has scaled alongside the broader AI buildout [13]. By the end of 2025, the state had permitted over 10,500 diesel generator units for data centers, totaling 27 GW of capacity, equivalent to the power consumption of over 20 million US homes in a state with fewer than 4 million homes [13]. Over 70% of Virginia's permitted diesel capacity still runs on older EPA Tier 2 emissions standards, which emit roughly nine times more nitrogen oxides and about 85% higher particulate matter than modern Tier 4 units, although more than half of newly permitted capacity now meets Tier 4 standards [13]. Notably, the Better Data Center Project documented that in June 2025, Tier 2 diesel generators in Virginia were used for demand-response participation during a heatwave, not solely as emergency backup, evidence that the industry's practical use of standby generation has broadened beyond the strict emergency-only framing that most siting approvals assume [13].
Implications and Future Directions
The trajectory identified across NVIDIA's roadmap, Vertiv's and Schneider Electric's reference designs, and the Stanford/Microsoft Azure Research stranding paper points toward a data center electrical architecture that looks structurally different by 2028 than it does in 2026. The clearest technical shift is the move from AC-based low-voltage rack distribution toward 800 VDC, which NVIDIA and its ecosystem partners across silicon, power systems and component manufacturing are targeting for 1 MW racks starting in 2027 [6]. If realized at the promised up to 5% efficiency gain and up to 30% total cost of ownership reduction [6], this transition would materially change the economics of gigawatt-class campuses, but it also requires a coordinated ecosystem shift across chip vendors, power electronics suppliers and installers that has not previously been attempted at this voltage class in commercial data centers.
Second, the divergence between "harden everything on-site" and "buy reliability from the grid" design philosophies, exemplified respectively by Vertiv's 2N reference architecture and Microsoft's Fairwater utility-diversity model, is likely to persist rather than converge, because it reflects genuinely different risk tolerances and site-selection constraints rather than a simple cost-optimization gap. Operators with access to exceptionally reliable, diverse utility feeds will increasingly follow the Fairwater model to reduce capital expenditure; operators in constrained or less reliable grid regions, or those requiring formal Tier III/IV certification for contractual or insurance reasons, will continue to specify full on-site 2N or Enhanced N+1 redundancy. The stranded-capacity research from Azure suggests that the deployability of provisioned capacity over a multi-year fleet lifecycle, not just its nameplate rating, should become a standard part of this decision, since a nominally cheaper design can prove materially more expensive once placement feasibility and harvesting behavior are modeled over an eight-year horizon [5].
Third, grid access itself, rather than equipment lead time, is emerging as the primary scheduling constraint on new GPU cluster capacity. With over 2,500 GW globally and 438 GW in Texas alone stuck in interconnection queues [12], the practical design decision for many campuses is no longer "what redundancy tier do we build" but "what mix of behind-the-meter generation, battery storage and utility purchase gets electrons to the site inside a 24 to 48 month commercial window" [12]. Battery energy storage systems are likely to play a growing role here, both as UPS replacements offering millisecond-scale cutover and as grid-stabilization assets that smooth the power oscillations large synchronized training runs create, a use case Microsoft has already begun deploying at Fairwater [2].
Finally, regulatory scrutiny of on-site generation, illustrated by both the EPA's 2026 ruling against xAI's portable turbine loophole and FERC's June 2026 show-cause orders on large-load interconnection [27] [12], signals that the regulatory environment for behind-the-meter and co-located generation is tightening even as demand for it grows. Electrical designers and capacity planners should expect compliance costs and permitting timelines for gas turbine and diesel backup to rise over the next several years, further strengthening the relative attractiveness of grid-purchase and battery-storage strategies where reliable utility capacity is available.
Frequently Asked Questions (FAQs)
What is a typical power density for a GPU cluster rack today? Current-generation NVIDIA GB200 and GB300 NVL72 racks draw between 120 kW and 142 kW in vendor reference designs, with production deployments measured as high as 132 kW sustained [16] [1], well above the 10 to 30 kW range that still describes most industry racks overall [3].
How is a UPS sized for a data center? Total connected load is converted to a common metric (kVA), a 20 to 25% capacity buffer is added for headroom and expansion, and the result is rounded up to a standard UPS size, with adjustments for the actual power factor of the UPS to determine real-power (kW) output [19].
Why do data centers use diesel generators for backup power? Diesel offers the highest energy density among common backup options, allowing generators to run for up to 96 hours on site-stored fuel, and lower upfront capital cost, roughly $1,000 per kilowatt versus about $1,300 per kilowatt for a four-hour battery system as of mid-2025 estimates [13].
What is the difference between N+1 and 2N redundancy? N+1 adds one extra unit beyond the minimum needed for full load, tolerating a single component failure at lower capital cost, while 2N fully duplicates the entire architecture into two independent paths, each capable of carrying the full load alone [22].
How is utility power planned for a new AI data center? Planning begins with interconnection-queue position and available substation capacity, given that over 2,500 GW of projects are stalled in global queues; large operators increasingly pursue co-located natural gas, nuclear or renewable-plus-storage generation to bypass queue delays entirely [12].
Can a data center avoid on-site UPS and generators entirely? Yes, if it can secure a sufficiently reliable utility feed; Microsoft's Fairwater Atlanta site targets "4x9" availability at "3x9" cost from grid power alone and forgoes on-site generation, UPS and dual-corded distribution for its GPU fleet, though this remains an exception rather than the norm across the industry [2].
Conclusion
Data center electrical design for GPU clusters has moved from an incremental engineering discipline to a first-order capital and siting decision in the span of roughly three hardware generations. Rack power density has climbed from the 10 to 30 kW band that still describes most of the installed base to 120 to 142 kW in current production GPU clusters, with credible vendor and academic projections placing next-generation racks at 500 kW to 1 MW before the end of the decade. That shift cascades through every layer of the power chain: busway ampacity, transformer sizing methodology, UPS topology, generator fuel storage, and now the fundamental choice of AC versus DC distribution voltage inside the rack itself.
The redundancy vocabulary that has organized data center reliability planning for thirty years, N, N+1, 2N and 2N+1, still applies, but GPU clusters have forced its reinterpretation at both ends of the spectrum: NVIDIA's own DGX SuperPOD guidance now requires three discrete power paths per rack rather than the traditional two, while some of the largest AI campuses are choosing to substitute utility-grade reliability for on-site redundancy hardware altogether. Neither approach is objectively superior; each represents a defensible response to the same underlying scarcity of capital, land and, above all, available grid capacity. With more than 2,500 gigawatts of generation and large-load capacity stalled in interconnection queues worldwide, and diesel generator capacity dedicated to US data centers having nearly tripled in six years, the central finding of this report is that the binding constraint on GPU-cluster electrical design in 2026 sits upstream of the data center fence line, in utility interconnection timelines and generation procurement, more than it sits in the switchgear room. Electrical engineers, capacity planners and infrastructure investors evaluating new GPU-cluster projects should treat grid access strategy as a first-order design input alongside rack density, redundancy tier and cooling topology, not as a downstream logistics detail to be resolved after the electrical single-line diagram is finalized.
External Sources (27)
About
GPUSmith
Plan and build private AI compute with GPU Smith. We connect workload requirements with GPU hardware, networking, deployment and operating decisions so your infrastructure fits the work it must perform.
GPU Smith provides independent engineering and research for private AI infrastructure. We help technical buyers and operators reason about GPU workload sizing, hardware selection, procurement, deployment and inference operations, from the compute system to the networking, power and cooling requirements around it.
Start with the workload
Useful infrastructure decisions begin with the models, data, throughput, latency and operating constraints a team actually has. GPU Smith helps connect those requirements with system design and deployment choices. The goal is a privately controlled AI environment whose capacity and operational demands are understood before a purchasing decision.
Hardware and supplier research
Our public reference library covers GPUs, complete systems and networking components. The server-vendor directory and manufacturing research help teams investigate suppliers, compare options and follow sources behind technical claims. We distinguish manufacturer specifications from measured benchmarks and advertised capabilities from tested configurations. Reference pages are research resources, not a live inventory listing or a binding equipment quote.
Deployment and operations
GPU Smith's engineering scope includes infrastructure integration, networking, power, cooling and the practical operation of inference workloads. Our published articles explain the tradeoffs behind deployment, procurement and ongoing operations so teams can ask better questions and document decisions.
Work with GPU Smith
Explore the hardware library, GPU references, networking references and vendor research. Contact GPU Smith with your workloads and deployment constraints to discuss a project and confirm current scope, pricing and availability.
Inclusion of a manufacturer or product in our research does not imply a partnership, certification or endorsement.
Disclaimer
This document is provided for informational purposes only. No representations or warranties are made regarding the accuracy, completeness, or reliability of its contents. Any use of this information is at your own risk. GPUSmith shall not be liable for any damages arising from the use of this document. This content was generated with assistance from artificial intelligence tools, which may contain errors or inaccuracies. Readers should verify critical information independently. All product names, trademarks, and registered trademarks mentioned are property of their respective owners and are used for identification purposes only. Use of these names does not imply endorsement. This document does not constitute professional or legal advice. For specific guidance related to your needs, please consult qualified professionals.