
GPUSmith Article
What Is a Good GPU Utilization Percentage? The 80% Target
Summary
- 01There is no single good GPU utilization percentage: NVIDIA's DCGM guidance sets an 80 percent SM Activity floor for AI training, while inference workloads normally run 40 to 70 percent.
- 02NVIDIA's DCGM documentation states an SM Activity value of 0.8 or greater is necessary but not sufficient for effective GPU use, while below 0.5 likely indicates ineffective usage.
- 03Cast AI's 2026 report found enterprise-wide GPU utilization averaged just 5% before optimization, versus roughly 50% in optimized production systems.
- 04The nvidia-smi utilization percentage only measures whether a kernel was running, not efficiency: a GPU can show 100% utilization while performing poorly.
- 05PaLM achieved 46.2% Model FLOPs Utilization on 6,144 TPU v4 chips, versus 21.3% for GPT-3 and 32.5% for Gopher, showing MFU reads far lower than kernel-presence utilization.
- 06Meta's Llama 3 clusters reached a 90%+ range for AllGather collective-communication bandwidth after optimization, a communication metric, not a GPU-utilization measurement.
Inside this article
- 01What Is a Good GPU Utilization Percentage? The 80% Target
- 02Introduction and Background
- 03What GPU Utilization Actually Measures
- 04How Much GPU Utilization Is Good? Benchmarks by Workload
- 05What Causes Low GPU Utilization
- 06How to Monitor and Increase GPU Utilization
- 07Data Analysis and Evidence
- 08Case Studies and Real-World Examples
- 09Implications and Future Directions
- 10Frequently Asked Questions (FAQs)
- 11Conclusion
What Is a Good GPU Utilization Percentage? The 80% Target
Executive Summary
There is no single number that defines a good graphics processing unit (GPU) utilization percentage, because the metric means something different depending on whether the workload is gaming, video rendering, model training, or production inference. For sustained artificial intelligence (AI) training on data center GPUs, the practical target that recurs across vendor documentation and industry benchmarks is roughly 80 to 95 percent, with NVIDIA's own Data Center GPU Manager (DCGM) documentation stating that a Streaming Multiprocessor (SM) activity value of "0.8 or greater is necessary, but not sufficient, for effective use of the GPU," while "a value less than 0.5 likely indicates ineffective GPU usage" [1]. For consumer and creative workloads, the healthy range is far wider: PC gaming commonly runs GPU utilization anywhere from the mid-20s to nearly 100 percent depending on frame-rate caps, while general productivity tasks may sit in the single digits without indicating a problem [2].
The gap between this technical target and real-world enterprise practice is large and well documented as of July 2026. Cast AI's 2026 State of Kubernetes Optimization Report, based on direct measurements across tens of thousands of production clusters on Amazon Web Services (AWS), Google Cloud, and Microsoft Azure, found that average GPU utilization "stood at just 5%" before any optimization was applied [3]. The same report estimated that enterprises are running with "an average of roughly 20 times the GPU capacity they actively use" [4], a finding consistent with Gartner's estimate that AI infrastructure spending will add $401 billion in new spending in a single year [5]. Earlier surveys tell a similar story from different angles: Run:AI's 2021 State of AI Infrastructure Survey of 211 practitioners found that "just 17% of AI companies are able to achieve high utilization of their expensive AI resources" [6], and a 2024 survey by ClearML, the AI Infrastructure Alliance, and FuriosaAI found that "only 7% of companies believe their GPU infrastructure achieves more than 85% utilization during peak periods" (Source: clear.ml).
Meta's 24,576-GPU Llama 3 clusters demonstrate how topology-aware scheduling and network routing can improve collective communication. Meta reported that normalized AllGather collective-communication bandwidth/utilization returned to the "ideal 90%+ range" after optimizing network topology and job scheduling [7]. This is a communication-performance result, not a GPU-utilization measurement. Separately, Meta reported that the Llama 3 team "maintained more than a 90 percent effective training time" despite hundreds of hardware interruptions during the run [8]. At a different benchmark scale, distributed-cache testing under the MLCommons MLPerf Storage benchmark held GPU utilization "above 98%" across a simulated 1,000-GPU BERT training run [9]. This report also examines the closely related but distinct metric of Model FLOPs Utilization (MFU), popularized by Google's PaLM paper, which measures the ratio of achieved to theoretical peak computational throughput rather than simple kernel presence; PaLM achieved a reported "46.2%" MFU on 6,144 TPU v4 chips, compared with 21.3 percent for GPT-3 [10] and 32.5 percent for Gopher [10].
The remainder of this report defines what GPU utilization actually measures at the hardware level, distinguishes it from GPU memory usage, walks through workload-specific benchmarks, catalogs the most common root causes of underutilization (data pipeline starvation, undersized batches, and communication bottlenecks chief among them), and details the monitoring stack (nvidia-smi, DCGM, cloud-native tooling from AWS and Google Cloud, and third-party platforms such as Datadog) and optimization techniques (mixed precision, asynchronous data loading, GPU sharing, and cluster scheduling) that can improve utilization beyond the low enterprise-wide averages reported in surveys and telemetry studies. Underutilized GPUs, as one training-efficiency guide summarizes, "result in idle processing power, memory bandwidth limitations, and inefficient use of expensive hardware" [11], a framing that runs through every section of this analysis.
Introduction and Background
Every organization running GPU-accelerated workloads eventually asks the same question: is this number on the dashboard good or bad? The GPU utilization percentage reported by tools such as nvidia-smi has become the default proxy for hardware efficiency, yet it is one of the most widely misread metrics in computing. A GPU can report 100 percent utilization while its Tensor Cores sit almost entirely idle, and a GPU can report a modest 40 percent utilization while doing exactly the right amount of work for a latency-sensitive inference workload. Understanding what "good" means for this metric requires separating three different questions that are often conflated: is the GPU busy, is the GPU busy doing useful work, and is the organization getting economic value from the GPU it purchased or rented.
This report addresses the query "what is a good GPU utilization percentage" by walking through each of these layers in turn, grounded in NVIDIA's own technical documentation, peer-reviewed research on GPU cluster efficiency, and industry surveys conducted throughout 2021, 2024, and 2026 [6] (Source: clear.ml). The stakes for getting this right have risen sharply. As of July 2026, GPU capacity is simultaneously described as scarce and, according to multiple independent measurements, chronically underused. Cast AI's research, drawn from tens of thousands of production Kubernetes clusters, describes this as "direct measurements from tens of thousands of production clusters running on AWS, GCP, and Azure before any optimization was applied," rather than modeled estimates [3]. At the same time, unit economics for GPU capacity are becoming less forgiving: Cast AI notes that "for the first time since EC2 launched in 2006, GPU prices are rising, not falling," citing an AWS H200 Capacity Block price increase of 15 percent in January 2026 [3]. Because "good" utilization depends heavily on context, this report organizes its analysis by workload category (consumer, creative, AI training, AI inference, and multi-tenant data center) rather than proposing a single universal threshold. It also draws a hard line between the coarse nvidia-smi utilization percentage and the more granular profiling metrics, such as SM Activity and Tensor Activity, exposed by NVIDIA's DCGM, since the two numbers answer meaningfully different questions and are frequently confused in procurement and capacity-planning discussions. Datadog frames the underlying stakes of this confusion in blunt financial terms, noting that "GPU infrastructure remains one of the most expensive and operationally complex components of running these AI or compute-intensive workloads at scale" [12]. Readers should treat every percentage in this report as time-bound: GPU pricing, cloud provider tooling, and reported industry benchmarks are all moving targets, and figures are anchored to their original publication or measurement date wherever the underlying source specifies one.
What GPU Utilization Actually Measures
The nvidia-smi Definition and Its Blind Spot
The single most consulted number in GPU monitoring comes from NVIDIA's own command-line utility, nvidia-smi. According to NVIDIA's official documentation, the GPU utilization field reports the "percent of time over the past sample period during which one or more kernels was executing on the GPU," with a sample period that "may be between 1 second and 1/6 second depending on the product" [13]. NVIDIA's broader framing of this field is that "utilization rates report how busy each GPU is over time, and can be used to determine how much an application is using the GPUs in the system" [13].
That definition is precise, and it is also the source of nearly every misunderstanding about the metric. The utilization percentage is a binary presence signal, not an efficiency signal: it registers whether any kernel was running, not how much of the chip's compute capacity that kernel actually used. As one technical analysis of the metric puts it, "GPU utilization percentage measures how often the GPU was executing at least one kernel in the last 100 ms sampling window. A GPU running a single inefficient kernel 100% of the time shows 100% utilization. A GPU running the same workload 10x faster also shows 100% utilization" [14]. The same analysis notes that this reading is "identical" for both a well-optimized step and a poorly-fused custom kernel, which is why the metric was "designed for fleet monitoring...and not for performance characterisation" [14]. In practical terms, a data center operator reporting 95 percent GPU utilization may have no idle hardware in the fleet-monitoring sense, yet still be leaving a large share of the chip's arithmetic throughput unused.
Beyond the Headline Number: SM Activity, Tensor Activity, and Model FLOPs Utilization
Because the plain utilization percentage cannot distinguish busy-but-idle from busy-and-productive, NVIDIA exposes a richer set of profiling counters through DCGM. The most important of these is SM (Streaming Multiprocessor) Activity, defined as "the fraction of time at least one warp was active on a multiprocessor, averaged over all multiprocessors," with the explicit caveat that "'active' does not necessarily mean a warp is actively computing" since "warps waiting on memory requests are considered active" [1]. NVIDIA's own guidance ties this metric directly to the "good utilization" question: "A value of 0.8 or greater is necessary, but not sufficient, for effective use of the GPU. A value less than 0.5 likely indicates ineffective GPU usage" [1]. This is the closest thing to an authoritative, vendor-published "80 percent target" for AI workloads, not the coarse nvidia-smi percentage, but the SM Activity profiling field. A related field, SM Occupancy, measures "the fraction of resident warps on a multiprocessor," with NVIDIA cautioning that "higher occupancy does not necessarily indicate better GPU usage" [1].
Tensor Activity narrows the lens further to the specialized matrix-multiply hardware used by deep learning, defined as "the fraction of cycles the tensor (HMMA / IMMA) pipe was active," where "higher values indicate higher utilization of the Tensor Cores" [1]. NVIDIA's Run:ai documentation packages this same family of counters for enterprise monitoring, noting that DCGM profiling "provide[s] deep visibility into GPU performance, including SM utilization, memory bandwidth, tensor core activity, and compute pipeline behavior, extending beyond standard GPU utilization metrics" [15]. NVIDIA also cautions that "some metrics require multiple passes to be collected and therefore all metrics cannot be collected together" on certain GPU architectures, which affects how these fields are sampled in production [1].
At the model-training level, the field has converged on an even higher-level metric: Model FLOPs Utilization (MFU), introduced formally in Google's PaLM paper. MFU is defined as "the ratio of the observed throughput (tokens-per-second) relative to the theoretical maximum throughput of a system operating at peak FLOPs," explicitly excluding the extra floating point operations spent on rematerialization so that it "allows fair comparisons between training runs on different systems" [10]. Reported MFU figures illustrate just how far "good" utilization at the SM-activity level can be from "good" utilization at the arithmetic-throughput level: PaLM's own training run reported a hardware FLOPs utilization of 57.8 percent alongside its 46.2 percent MFU, while the MFU figure for GPT-3 was calculated at 21.3 percent [10] and Gopher's at 32.5 percent [10]. A cluster can post a near-perfect nvidia-smi reading, a strong SM Activity figure above 80 percent, and still convert less than a third of its theoretical peak FLOPs into useful model throughput.
GPU Utilization vs. Memory Usage
The second most common source of confusion is conflating GPU compute utilization with GPU memory usage, two signals that move independently. NVIDIA's own documentation defines memory utilization as "percent of time over the past sample period during which global (device) memory was being read or written," a measure of memory bus activity, not capacity consumption [13]. Frame buffer (FB) memory used, by contrast, simply reports how many megabytes of video random-access memory (VRAM) are allocated, and NVIDIA notes that "pages allocated from FB memory are not released even after the process terminates to enhance performance," which can make allocated memory appear high long after the workload has finished computing [13].
This distinction has direct diagnostic value. A widely cited operational guide notes that "GPU core utilization is the percentage of time kernels are actively executing on SMs during the sampling window," while GPU memory utilization "usually refers to memory controller activity, while memory usage is allocated VRAM in MiB" [16]. The same guide observes that "low core utilization with high allocated VRAM often means the model is resident but waiting on data or synchronization" [16], a pattern the same guide summarizes as most GPU incidents in machine learning pipelines coming "from input bottlenecks or VRAM pressure" [16]. Both AWS and Google Cloud expose the two figures side by side for this reason: Google's Compute Engine monitoring documentation tracks "GPU utilization and GPU memory from your virtual machine (VM) instances" as separate, correlated series precisely so that operators can "optimize costs by identifying underutilized GPUs and consolidating workloads" [17].
How Much GPU Utilization Is Good? Benchmarks by Workload
Consumer and Creative Workloads
For consumer hardware, the answer to "is this GPU utilization good" varies enormously by application, and a low number is frequently the correct outcome rather than a fault. A widely referenced consumer hardware guide summarizes typical ranges: general productivity tasks such as writing and simple browsing land around 0 to 15 percent, video playback around 15 to 35 percent, PC gaming anywhere from roughly a quarter to nearly full utilization depending on frame caps, and GPU-accelerated 3D rendering engines (Octane, Redshift, V-Ray, Arnold GPU, Cycles) frequently approach, but do not always reach, 100 percent [2]. The same source cautions that "the most that your GPU should be taxed is by watching videos and other lightweight use cases" until a genuinely GPU-accelerated workload begins [2], and adds that Windows' built-in Task Manager "doesn't do a great job at displaying CUDA workload utilization," recommending dedicated tools such as GPU-Z for professional rendering workloads [2].
Gaming deserves special mention because it is the context in which most consumers first encounter the utilization percentage, and where the metric is most often misread as a bottleneck indicator. One technical explainer argues that "GPU usage, as a metric, is only useful when it depicts an extreme disparity between the GPU and CPU utilization," and that people "tend to overestimate CPU bottlenecks" when GPU usage merely dips into the 80s [18]. The same piece notes that "GPU utilization is dynamic, and the factors that influence it are varied," and that capping frame rate to a target refresh rate is a legitimate way to intentionally reduce utilization without harming perceived performance [18]; deliberately capping utilization can even extend hardware life, since "undervolting your GPU has genuine advantages for cutting down on power consumption and extending the life of your graphics card" [18]. In this context, "good" utilization is whatever number produces smooth, consistent frame times, not the number that maximizes the percentage on the overlay.
AI Training: An 80 Percent SM Activity Floor
For AI model training on data center accelerators, the calculus changes completely, because idle GPU cycles translate directly into wasted rented or depreciating capital. Here, the closest thing to an authoritative numeric floor comes from NVIDIA's own DCGM documentation on SM Activity, where "0.8 or greater is necessary, but not sufficient, for effective use of the GPU" and "a value less than 0.5 likely indicates ineffective GPU usage" [1]. Real-world large-model training runs corroborate this range at the high end: Meta reported that its optimized 24,576-GPU clusters return "to the ideal 90%+ range" once network and scheduling issues are resolved, up from an unoptimized range of "10% to 90%" [7], part of a broader roadmap in which Meta stated it was building toward "350,000 NVIDIA H100 GPUs" by the end of 2024 [7].
It is important to separate this SM-level target from MFU, which is a stricter and typically lower-looking number precisely because it accounts for whether the busy cycles were spent on useful forward-and-backward-pass arithmetic. PaLM's reported 46.2 percent MFU on 6,144 TPU v4 chips was described in the original paper as "a notably high MFU" relative to prior large models, achieved "because of several optimizations across the model, compiler, and parallelism strategy" [10]. Reading a raw nvidia-smi percentage of 95 percent and an MFU of 45 percent from the same job is not a contradiction; it reflects two different, valid questions being answered by two different metrics. The practical implication for anyone setting an internal target is to track SM Activity or Tensor Activity (targeting 80 percent or higher) as the operational floor for "the GPU is not starved," and to track MFU separately as the harder ceiling for "the GPU is being used near its architectural limit."
AI Inference and Serving
Inference workloads systematically produce lower and more variable utilization numbers than training, and this is frequently the correct, economically rational outcome rather than a fault to be engineered away. One detailed technical breakdown of GPU benchmarking notes that "inference at batch=1" often shows utilization of only "40 to 70 percent," which is "expected for latency-optimised serving" [14]. The same analysis describes the inference utilization curve as request-driven: "at low concurrency, both utilization and latency are low; as concurrency rises, utilization climbs while latency stays roughly flat, until a saturation point, beyond which utilization plateaus near 100% and tail latency rises sharply" [14], whereas training workloads "typically show high, steady GPU utilization with periodic dips that correspond to gradient synchronisation in distributed training" [14]. This has a direct bearing on how "good" utilization should be interpreted for a production inference fleet: the useful benchmark is not the raw utilization average but the location of that saturation knee relative to actual traffic. Cast AI's data underscores why this distinction matters economically: "the standard deployment model gives each model its own dedicated GPU instance," which is wasteful "for most inference workloads" because "request rates are bursty, with long idle periods between them," and "on dedicated instances, those idle periods cost the same as full utilization" [3].
Sustained Utilization in Data Centers and Cloud Clusters
At the scale of an entire data center or cloud fleet, "good" utilization is best understood as a moving target between an achievable ceiling and a much lower observed average. The MLCommons MLPerf Storage benchmark provides a useful reference ceiling: testing against a simulated 1,000-GPU BERT training workload, one storage vendor's distributed cache configuration held GPU utilization "above 98%," while the same benchmark states plainly that "over 90% indicates a passing grade, which demonstrates that the storage system can meet the performance requirements of training tasks" [9]. Without adequate caching, however, the same benchmark environment showed utilization at 110 GPUs "below 90%," and, in an even more constrained no-cache configuration, "GPU utilization was only 49%" [9].
Set against that achievable ceiling, the observed fleet-wide average across real enterprise deployments is dramatically lower. Cast AI's 2026 measurement puts the enterprise-wide average at 5 percent, but the same report identifies at least one cluster in its dataset, 136 H200 GPUs sustaining 49 percent GPU utilization [3], prompting the report's authors to conclude that "the ceiling isn't theoretical. The fleet average is 5%. The gap is 10x" [3]. Cast AI co-founder Laurent Gil, discussing the finding with AIwire, said the gap "was unexpectedly low" and that in optimized environments "GPU utilization can reach around 50% on average, a level Gil described as a reasonable benchmark for production systems" [4]. Read together, these figures suggest a workable three-tier framework: below roughly 20 percent sustained utilization in a training or batch inference cluster is a red flag worth an AWS-style automated alert, since AWS's own CloudWatch tutorial recommends notifying operators "when the GPU utilization is lower than 20% for the duration of model training" [19]; roughly 50 percent represents a realistic, optimized production average across mixed inference and training fleets; and 80 to 98 percent represents the achievable ceiling for dedicated, well-tuned, large-scale training runs.
Table 1 below consolidates these workload-specific benchmarks into a single reference.
| Workload category | Typical or target GPU utilization | Source |
|---|---|---|
| General productivity / browsing | Roughly 0 to 15 percent | cgdirector.com consumer hardware guide [2] |
| PC gaming | Highly variable; near 100 percent is common but not required for a good experience | XDA Developers analysis of gaming GPU utilization [18] |
| AI inference at low concurrency (batch=1) | Roughly 40 to 70 percent, and this is expected | TechnoLynx GPU benchmarking analysis [14] |
| AI training, DCGM SM Activity floor | 0.8 (80 percent) or greater | NVIDIA DCGM Feature Overview [1] |
| Large-cluster AllGather communication (Meta Llama 3) | 90 percent or higher normalized collective-communication bandwidth/utilization after optimization; not a GPU-utilization result | Meta Engineering, Building Meta's GenAI Infrastructure [7] |
| AI training, MLPerf Storage benchmark (1,000-GPU BERT) | Above 98 percent (passing grade is above 90 percent) | JuiceFS MLPerf benchmark report [9] |
| Enterprise fleet-wide average (2026, pre-optimization) | Approximately 5 percent | Cast AI 2026 State of Kubernetes Optimization Report [3] |
| Enterprise fleet-wide average, optimized production systems | Approximately 50 percent | Cast AI co-founder Laurent Gil, via AIwire/HPCwire [4] |
| Recommended alert threshold during training | Below 20 percent sustained | AWS CloudWatch GPU monitoring guidance [19] |
As the table illustrates, there is no single correct percentage. Consumer and inference workloads have a wide legitimate range; for dedicated AI training, NVIDIA identifies 80 percent or higher SM Activity as an efficiency floor, while separate nvidia-smi benchmark results can be much higher. These metrics should not be combined into one generic GPU-utilization target. The interpretive takeaway is that context, not a universal benchmark, should set the target: a data scientist debugging a training job should be alarmed by 20 percent utilization, while a site reliability engineer (SRE) monitoring a bursty inference endpoint should not be alarmed by the same number.
- Training workloads show high, steady utilization with periodic dips for gradient synchronization.
- NVIDIA's DCGM guidance sets an SM Activity floor of 0.8 (80%) as necessary but not sufficient for effective GPU use.
- Low-concurrency inference commonly runs at 40 to 70 percent utilization, which is expected for latency-optimized serving.
- As request concurrency rises, utilization climbs until a saturation point where it plateaus near 100% and tail latency spikes.
These metrics answer different questions and should not be combined into one generic GPU-utilization target.
GPU utilization percentage measures how often the GPU was executing at least one kernel in the last 100 ms sampling window. A GPU running a single inefficient kernel 100% of the time shows 100% utilization. A GPU running the same workload 10x faster also shows 100% utilization
What Causes Low GPU Utilization
Data Pipeline and I/O Starvation
The single most frequently cited root cause of low GPU utilization in AI training is data pipeline starvation: the GPU finishes its compute step faster than the rest of the system can prepare the next batch. One infrastructure-focused explainer lists the usual suspects plainly: "CPU preprocessing, tokenization, synchronous input loading, tiny batches, framework overhead, network or storage delays" [20]. The same source frames the diagnostic discipline required: "low gpu utilization ml is often a pipeline problem," and the guiding rule should be to "prove what the GPU is waiting on" before assuming the hardware itself is the bottleneck [20].
A separate practical guide echoes the same diagnosis for near-zero utilization readings: "if GPU utilization sits near 0% during training, the GPU is usually waiting for something else rather than doing useful work," and "the most common causes are an input pipeline bottleneck, batches that are too small, CPU-bound preprocessing, or the fact that tools like nvidia-smi sample utilization so coarsely that short bursts of GPU work look like idleness" [20]. Formal storage benchmarking corroborates the scale of the effect: in the MLPerf-based test described earlier, GPU utilization "slowly declined as the number of nodes increased" without adequate caching, and once distributed caching was applied, utilization rose in lockstep with cache hit rate, from 49 percent uncached to 93.1 percent at an 85 percent cache hit rate, up to a peak of "98.8%, almost fully loaded" once the cache hit rate reached 100 percent [9]. Storage and data throughput are therefore not a peripheral concern for GPU efficiency; in large-scale training they are frequently the binding constraint.
Batch Size, Framework Overhead, and Kernel Inefficiency
Even with a fully saturated data pipeline, GPUs can sit underutilized because the unit of work handed to them on each step is too small to fill the chip's parallel execution units. One technical guide to model training efficiency explains the mechanics directly: "large batches generally lead to better GPU utilization by increasing parallelism and reducing the overhead of parameter updates," whereas "small batch sizes lead to underutilized GPUs, reducing parallelism," since "the GPU processes fewer samples which leads to idle time" [11]. For inference specifically, a small batch (or batch size of one) is often a deliberate design choice made to minimize latency, and the resulting lower utilization number, as noted earlier, should be read as a design trade-off rather than a fault.
Framework and kernel-level inefficiency is a second, subtler variant of the same underlying problem. As one performance analysis explains, "a GPU showing 100% utilization can still be performing poorly," because "the utilization metric from nvidia-smi indicates that at least one CUDA kernel was active during each sampling period, it says nothing about what that kernel was doing," and "a memory-copy kernel, a poorly parallelised custom kernel, or an inefficient attention implementation all show as 100% utilization while leaving most of the GPU's compute units idle" [14]. For this reason, "GPU utilization should always be reported alongside throughput in samples per second or tokens per second," since two configurations can post identical utilization while one processes far more useful work per cycle [14]. This is precisely the gap that SM Activity, Tensor Activity, and MFU are designed to close.
Distributed Training and Communication Bottlenecks
At multi-GPU and multi-node scale, a third category of cause emerges: the time GPUs spend waiting on network communication for gradient synchronization, collective operations, or checkpointing. Meta's Llama 3 infrastructure account illustrates the communication side of this problem: its AllGather graph showed normalized collective-communication bandwidth/utilization ranging from 10% to 90% for an unoptimized large cluster. Meta addressed this with topology-aware job scheduling and network-routing and NCCL changes to improve network utilization [7]. The graph is not a measurement of GPU utilization.
Hardware reliability compounds this problem at scale. Meta's 16,384-GPU Llama 3 training run experienced enough interruptions that Meta researchers wrote, "the complexity and potential failure scenarios of 16K GPU training surpass those of much larger CPU clusters that we have operated," adding that "the synchronous nature of training makes it less fault-tolerant, a single GPU failure may require a restart of the entire job" [8]. Despite this, Meta reported that the team "maintained more than a 90 percent effective training time" because "significant manual intervention was only required three times during this period, with the rest of the issues handled by automation" [8].
Academic research on multi-tenant clusters reaches a similar conclusion from a different angle. Microsoft's widely cited analysis of a multi-tenant GPU cluster, based on "a two-month long trace from a multi-tenant GPU cluster in Microsoft," specifically studied "the effect of gang scheduling and locality constraints on queuing" and "the effect of locality on GPU utilization" as first-order causes of reduced cluster efficiency, alongside job failures during training [21]. A separate, more recent empirical study from Microsoft Research, published at the IEEE/ACM International Conference on Software Engineering, examined "400 real jobs (with an average GPU utilization of 50% or less)" drawn from Microsoft's internal deep learning platform and "discover[ed] 706 low-GPU-utilization issues through meticulous examination of job metadata, execution logs, runtime metrics, scripts, and programs" [22]. This finding, drawn from real production jobs at one of the largest cloud operators in the world, is strong evidence that low GPU utilization is common even inside organizations with deep in-house machine learning operations expertise.
Organizational and Procurement Causes
The final category of cause is organizational rather than technical: capacity is acquired for reasons unrelated to current workload demand. Cast AI's Laurent Gil described the underlying behavior candidly: "it's expensive, it's impossible to find, and you really need it. When these three things come together, what do we do as humans? We buy everything we can find" [4]. The same report notes that GPUs "often require long-term commitments," which "encourages companies to provision for peak demand or future needs rather than actual usage," and that "once that capacity is locked in, it is not easily scaled down, even during periods of low demand" [4].
Earlier survey data points to the same structural issue from a scheduling-tooling angle. The 2024 ClearML, AI Infrastructure Alliance, and FuriosaAI survey found that "only 19% of respondents actually have a scheduling tool that supports the ability to view and manage jobs within queues and effectively optimize GPU utilization," even though "74% of respondents see value in having compute and scheduling functionality as part of a single, unified AI/ML platform" (Source: clear.ml). Run:AI's earlier 2021 survey of 211 practitioners found that "22% of those building AI solutions say that their infrastructure mostly sits idle, as more than a third of respondents have to manually request access to GPU resources and are stuck with static allocations of hardware accelerators" [6]. Datadog's own framing of the stakes captures why this matters financially: "even a 5% idle gap in GPU utilization can translate to millions of dollars lost" at enterprise scale [12], a phenomenon Datadog attributes partly to "zombie processes" that are "often the primary source of wasted GPU spend, as they inappropriately hold on to GPU capacity" [12].
How to Monitor and Increase GPU Utilization
Monitoring Tools and Metrics
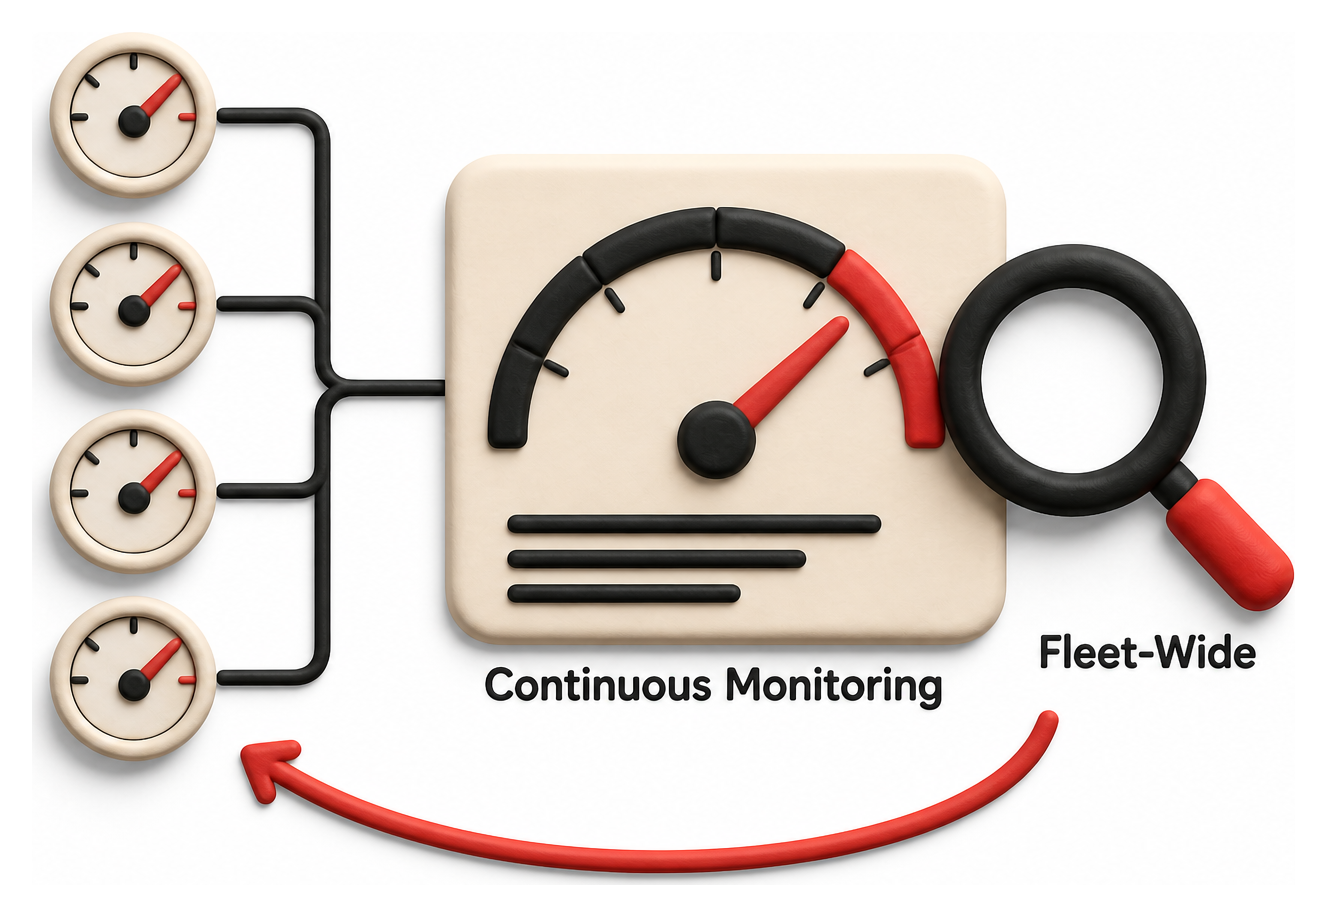
The monitoring stack for GPU utilization has matured considerably beyond a single nvidia-smi snapshot. At the command-line level, NVIDIA recommends continuous sampling rather than single reads, since a coarse snapshot can miss short bursts; nvidia-smi dmon and the --query-gpu interface expose utilization, memory, encoder, decoder, and power metrics at configurable frequency [13]. For fleet-wide and production monitoring, NVIDIA's DCGM is the standard tool, and it "enables the collection of a set of metrics using the hardware counters on the GPU" at "low performance overhead in a continuous manner" [1].
The major cloud providers have built native integrations on top of this same telemetry layer. AWS's CloudWatch integration collects GPU metrics through the NVIDIA Management Library (NVML) and pushes them as custom metrics, with the platform's own blog describing how "with nvidia-smi, users query information about the GPU utilization, memory consumption, fan usage, power consumption, and temperature of their NVIDIA GPU devices" before those readings are surfaced in CloudWatch dashboards and alarms [19]. Google Cloud's Ops Agent performs a similar function for Compute Engine and can automatically track "GPU utilization and GPU memory usage rates" once installed [17], and its DCGM integration specifically exposes "Streaming Multiprocessor (SM) block utilization, SM occupancy, SM pipe utilization, PCIe traffic rate, and NVLink traffic rate" directly into Cloud Monitoring dashboards [17]. Third-party observability platforms have converged on the same layered approach: Datadog's GPU Monitoring product combines "memory utilization, streaming multiprocessor activity" and other DCGM-sourced signals into a single fleet view so that "platform SREs, ML engineers, data scientists, and FinOps teams can understand GPU capacity, workload performance, health, and cost in one centralized view" [12].
For Kubernetes environments specifically, NVIDIA's DCGM Exporter is the standard bridge to Prometheus and Grafana, exposing fields such as DCGM_FI_DEV_GPU_UTIL for basic utilization and DCGM_FI_PROF_SM_ACTIVE for the profiling-level SM activity signal discussed earlier in this report [15]. Choosing which layer to monitor matters: a team that only tracks DCGM_FI_DEV_GPU_UTIL will see the same fleet-monitoring blind spot described earlier in this report, whereas a team that also tracks SM Activity and Tensor Activity gains visibility into whether that utilization reflects productive compute.
Techniques to Raise Utilization
Once a monitoring stack has identified the location of underutilization, several concrete engineering levers are available, and they map directly onto the causes catalogued in the previous section. For data pipeline starvation, PyTorch's own performance tuning guide recommends enabling asynchronous data loading, since the default DataLoader setting of num_workers=0 "means that the data loading is synchronous and done in the main process," and "setting num_workers > 0 enables asynchronous data loading and overlap between the training and data loading" [23]. The same guide recommends pin_memory=True for faster host-to-device transfer, and enabling cuDNN's auto-tuner and CUDA Graphs to reduce launch overhead for repeated kernel shapes.
For compute-bound underutilization, mixed precision training is consistently the highest-leverage lever available on modern NVIDIA hardware. PyTorch's tuning guide states that mixed precision "leverages Tensor Cores and offers up to 3x overall speedup on Volta and newer GPU architectures" [23]. Batch size tuning is the second major lever: a practical guide to training efficiency recommends teams "optimize batch size to balance between GPU utilization and memory constraints" and "employ mixed-precision training to reduce memory usage and increase throughput," alongside gradient accumulation techniques that "simulate larger batch sizes by accumulating gradients over multiple smaller batches before updating model parameters" without exceeding available memory [11].
At the cluster and fleet level, sharing and scheduling levers dominate. Cast AI's own case study of ALLEN Digital, which had been running "7 models on SageMaker" with GPU instances that "ran continuously but served an intermittent load," found that "after moving to Kubernetes with GPU time-slicing enabled, a 50/50 on-demand/Spot split, and node bin-packing, utilization improved dramatically," leading to "20% savings immediately from time-slicing, 30 to 40% after consolidating models onto shared instances, and more than 70% total savings versus SageMaker after rightsizing CPU and memory alongside the GPU changes" [3]. Google Cloud's own guidance points in the same direction at the platform level, recommending that operators "optimize costs by identifying underutilized GPUs and consolidating workloads" and use "managed instance groups (MIGs) to autoscale resources" [17].
Data Analysis and Evidence
The quantitative picture of GPU utilization across the industry is broadly consistent across vendor-published telemetry, academic research, and surveys conducted years apart using different methodologies, and it points to a persistent structural gap between achievable and observed utilization. Table 2 below summarizes the major benchmarks referenced throughout this report.
| Study or benchmark | Key finding | Methodology and scale | Source |
|---|---|---|---|
| Cast AI, 2026 State of Kubernetes Optimization Report | Fleet-wide average GPU utilization of 5 percent; one 136-H200 cluster sustained 49 percent; CPU utilization measured at 8 percent and memory at 20 percent in the same dataset | Direct measurement across tens of thousands of production clusters on AWS, GCP, and Azure | [3] |
| Run:AI, 2021 State of AI Infrastructure Survey | Only 17 percent of AI companies achieve high utilization of their AI resources | Survey of 211 data scientists, ML/IT practitioners, and system architects across 10 countries | [6] |
| ClearML, AI Infrastructure Alliance, and FuriosaAI, 2024 survey | 15 percent of respondents use less than half of purchased GPUs at peak; only 7 percent exceed 85 percent peak utilization | Global survey of AI infrastructure decision-makers | (Source: clear.ml) |
| Microsoft Research / ICSE 2024 (Gao et al.) | 400 sampled real jobs averaged 50 percent GPU utilization or less; 706 distinct low-utilization issues identified | Empirical study of production jobs on Microsoft's internal deep learning platform | [22] |
| Microsoft Philly trace (Jeon et al., USENIX ATC 2019) | Gang scheduling, locality constraints, and failures identified as primary utilization-limiting factors | Two-month trace from a large multi-tenant production GPU cluster | [21] |
| JuiceFS / MLPerf Storage benchmark | Sustained above 98 percent GPU utilization at 1,000-GPU BERT training scale with distributed caching | Simulated large-scale training benchmark under MLCommons MLPerf Storage methodology | [9] |
| Google PaLM paper (Chowdhery et al., 2022) | 46.2 percent Model FLOPs Utilization on 6,144 TPU v4 chips, versus 21.3 percent for GPT-3 and 32.5 percent for Gopher | Peer-reviewed large language model training report | [10] |
| Meta GenAI Infrastructure (Llama 3 clusters) | Optimized 24,576-GPU clusters reached 90 percent or higher normalized AllGather collective-communication bandwidth/utilization; the unoptimized communication result ranged from 10 to 90 percent | First-party engineering disclosure of production cluster communication performance, not GPU utilization | [7] |
Two patterns stand out from this consolidated dataset. First, vendor-published telemetry (Cast AI), a peer-reviewed job-log analysis (Microsoft/ICSE), and practitioner surveys (Run:AI and ClearML) point to the same qualitative conclusion: most organizations operate well below the utilization or efficiency levels achieved in carefully engineered workloads. JuiceFS/MLPerf reports a benchmark-specific GPU-utilization result, and PaLM reports MFU; Meta's cited 90%+ result instead concerns collective-communication performance. These measures should not be treated as interchangeable. Notably, Cast AI's own dataset shows GPU utilization is a worse problem than CPU or memory utilization in the same clusters, where "CPU utilization fell to 8%, down from 10% last year," and "memory dropped from 23% to 20%" [3], a stark contrast with the 5 percent measured for GPUs. Second, the size of the gap has if anything widened rather than narrowed between the 2021 Run:AI survey (17 percent achieving high utilization) and the 2026 Cast AI measurement (5 percent average), a trend the Cast AI report links to the compressed timeline of the generative AI buildout, in which "the industry narrative of scarcity served as a convenient smokescreen for this inefficiency" while organizations were "activity-rich (buying chips) but output-poor (generating near-zero useful tokens)" [5]. Gartner's parallel estimate that AI infrastructure spending will add $401 billion in new spending this year gives the efficiency gap real financial stakes [5].
the ceiling isn't theoretical. The fleet average is 5%. The gap is 10x
Case Studies and Real-World Examples
Two-month production trace identified gang scheduling, locality constraints, and job failures as primary limits on multi-tenant GPU utilization.
540-billion-parameter model trained on 6,144 TPU v4 chips achieved 46.2% Model FLOPs Utilization, a stricter measure than kernel-presence utilization.
Vendor-neutral benchmark introduced to test how storage infrastructure affects GPU utilization at multi-hundred and multi-thousand GPU scale.
After topology-aware scheduling and network routing changes, Meta's 24,576-GPU clusters returned to a 90%+ range for collective-communication bandwidth, not raw GPU utilization.
Direct measurements across tens of thousands of production clusters found enterprise-wide average GPU utilization of just 5% before optimization.
Meta's Llama 3 Training Clusters
Meta's public disclosure of its Llama 3 training infrastructure is a detailed first-party account of collective-communication engineering at extreme scale. Meta built "two versions of our 24,576-GPU data center scale cluster," using its Grand Teton hardware platform, to support Llama 3 and successor models [7]. Its performance graph measures normalized AllGather collective-communication bandwidth/utilization, not GPU utilization: small-cluster communication performance reached "90%+ out of the box," while the unoptimized large-cluster result ranged from 10% to 90%. After topology-aware scheduling and NCCL/network-routing changes, large-cluster communication performance returned to the "ideal 90%+ range" [7]. Separately, Meta reported more than 90 percent effective training time for a 16,384-GPU Llama 3 run despite hardware interruptions [8]. Neither result establishes sustained GPU utilization of 90 percent or higher.
Microsoft's Philly Multi-Tenant GPU Cluster
Before large-scale generative AI training became common, Microsoft's Philly cluster provided one of the first rigorous academic looks at GPU utilization inside a real, large, multi-tenant production environment. Researchers from Microsoft Research and partner universities analyzed "a two-month long trace from a multi-tenant GPU cluster in a large enterprise," publishing their findings at USENIX ATC 2019 [21]. The study identified gang scheduling requirements, data and model locality constraints, and mid-run failures as the three central factors limiting cluster-wide GPU utilization, concluding that deep learning workloads "differ in two significant ways from traditional big data analytics workloads": GPUs are "a monolithic resource that cannot be shared at a fine granularity across users," and deep learning frameworks "require gang scheduling," which reduces scheduling flexibility and makes jobs "inelastic to failures at runtime" [21]. This case remains foundational because it established, with production data rather than synthetic benchmarks, that scheduling and locality, not raw hardware capability, are frequently the binding constraints on GPU utilization in shared environments, a conclusion later echoed by the 2024 Microsoft ICSE study's finding of 706 distinct low-utilization issues across a separate sample of 400 production jobs.
Cast AI's 2026 State of Kubernetes Optimization Report and the ALLEN Digital Migration
Cast AI's 2026 vendor-published telemetry report offers a large-scale view of GPU utilization in the production clusters it measured and also documents a concrete before-and-after remediation case. Within the same report, Cast AI describes ALLEN Digital, a customer running "7 models on SageMaker: 3 open-source and 4 custom," where "GPU instances ran continuously but served an intermittent load" [3]. After migrating "to Kubernetes with GPU time-slicing enabled, a 50/50 on-demand/Spot split, and node bin-packing," the company achieved "20% savings immediately from time-slicing, 30 to 40% after consolidating models onto shared instances, and more than 70% total savings versus SageMaker after rightsizing CPU and memory alongside the GPU changes," while "latency held throughout" the transition [3]. This case is instructive precisely because it sits at the opposite end of the spectrum from Meta's frontier-scale training clusters: it shows that meaningful utilization and cost gains are achievable for a modest, seven-model inference deployment using commodity techniques (time-slicing, spot capacity, bin-packing) rather than custom network engineering.
The MLPerf Storage Benchmark at 1,000-GPU Scale
The MLCommons MLPerf Storage benchmark, introduced in September 2023, provides a controlled, vendor-neutral test bed for measuring how storage infrastructure affects GPU utilization at scale, without requiring physical GPUs for every simulated node. JuiceFS, a distributed file system vendor, published detailed results from testing its distributed cache architecture against this benchmark, reporting that for the BERT natural language model workload, "JuiceFS maintained GPU utilization above 98%" at a simulated 1,000-GPU scale, and for the more bandwidth-intensive UNet3D 3D medical image segmentation workload, utilization was maintained "above 97%" at close to 500 simulated GPUs [9]. Comparative results published in the same benchmark round showed a national laboratory's Slingshot-networked cluster achieving 99.5 percent GPU utilization at 512-card scale, attributable to "sufficient hardware configuration" including 650 gigabytes-per-second read and write bandwidth [9]. This vendor-published, simulated test suggests that storage bandwidth and caching can materially affect the benchmark's modeled GPU-utilization result. It does not demonstrate sustained utilization on a physical multi-hundred- or multi-thousand-GPU training fleet.
Google's PaLM and the Model FLOPs Utilization Benchmark
Google's PaLM (Pathways Language Model) training run, described in a 2022 paper, remains the reference case for Model FLOPs Utilization as a training-efficiency benchmark distinct from nvidia-smi-style utilization. Google trained the 540-billion-parameter model "on 6144 TPU v4 chips using Pathways," and reported achieving "very high efficiency of 46.2% in model FLOPs utilization" and "57.8% in hardware FLOPs utilization" [10]. The paper explicitly benchmarks this figure against prior large models trained on different hardware: Gopher's MFU was calculated at 32.5 percent on 4,096 TPU v3 chips, and Megatron-Turing NLG 530B's MFU was calculated at 30.2 percent on 2,240 A100 GPUs [10]. Because the MFU metric is architecture- and framework-independent, this case remains the clearest illustration in the public record of just how much lower a genuinely rigorous efficiency metric can read compared with a simple kernel-presence utilization percentage, even for one of the best-engineered large-scale training runs ever publicly documented.
Implications and Future Directions
The consistent, multi-source finding that enterprise GPU utilization averages in the single digits to low double digits, while carefully tuned workloads can perform far better on workload-specific measures, has several forward-looking implications. First, the industry's center of gravity is visibly shifting from acquiring GPU capacity to extracting useful work from capacity already owned or rented. As one industry analysis puts it, organizations are "moving away from measuring GPU activity (how many chips are powered on) and toward measuring GPU productivity (how many useful tokens are generated per dollar spent)" [5]. This reframing has practical consequences for how organizations should evaluate infrastructure investments: a raw utilization percentage on a dashboard is an incomplete signal of return on investment unless it is paired with a throughput or cost-per-token measure, echoing the MFU-versus-nvidia-smi distinction developed earlier in this report.
Second, GPU sharing and partitioning techniques, GPU time-slicing, NVIDIA Multi-Instance GPU (MIG), and Kubernetes-native bin-packing, are likely to become standard practice rather than advanced optimization, given that Cast AI's ALLEN Digital case achieved substantial savings using exactly these commodity mechanisms rather than custom infrastructure. Google Cloud's own product guidance already frames managed instance groups and DCGM-based observability as core building blocks for this shift, recommending operators "plan scaling by looking at trends to decide when to expand GPU capacity or upgrade existing GPUs" [17].
Third, the economics of GPU underutilization are becoming harder to ignore as GPU prices rise rather than fall, reversing two decades of cloud-computing cost trends. With Cast AI documenting a 15 percent AWS price increase for H200 Capacity Blocks in a single month and Gartner projecting $401 billion in new AI infrastructure spending, the cost of tolerating a persistent utilization gap compounds rather than shrinks over time. Organizations that have historically treated utilization as an engineering metric owned by machine learning engineers are increasingly treating it as a financial operations (FinOps) metric owned jointly by platform, finance, and engineering teams, a shift visible in Datadog's positioning of GPU monitoring around "platform SREs, ML engineers, data scientists, and FinOps teams" working from "one centralized view" [12].
Finally, as inference workloads grow relative to training workloads across the industry, the definition of "good" utilization will likely continue to fragment rather than converge on a single number, since bursty, latency-sensitive inference traffic inherently produces different utilization signatures than dedicated, throughput-maximizing training runs. Organizations that adopt workload-specific benchmarks, rather than a single enterprise-wide target, are best positioned to interpret their own dashboards correctly and to avoid both false alarms over legitimately low inference utilization and false comfort from a high but low-value training utilization reading.
Frequently Asked Questions (FAQs)
What is a good GPU utilization percentage overall? There is no single correct number; a reasonable operational target for dedicated AI training is 80 percent or higher SM Activity, per NVIDIA's DCGM guidance [1], while 40 to 70 percent is normal and healthy for low-concurrency inference serving [14], and single-digit-to-mid-double-digit percentages are common, if suboptimal, at the level of an entire enterprise GPU fleet [3].
What is the ideal GPU utilization for AI training specifically? NVIDIA's DCGM documentation treats an SM Activity value of 0.8 (80 percent) or greater as "necessary, but not sufficient, for effective use of the GPU," while values below 0.5 (50 percent) "likely indicate ineffective GPU usage" [1]. Meta's Llama 3 infrastructure report does not provide a comparable GPU-utilization figure: its 90%+ result refers to normalized AllGather collective-communication bandwidth/utilization [7].
What is the difference between GPU utilization and GPU memory usage? GPU utilization measures the percentage of time a kernel was executing, while GPU memory usage measures allocated VRAM, and GPU memory utilization measures memory bus activity; a job can show high memory usage and low compute utilization simultaneously when it is resident but starved of input data [16].
What causes low GPU utilization? The most common causes are data pipeline and I/O starvation, undersized batches, framework or kernel overhead, distributed-training communication bottlenecks, and organizational procurement patterns that provision capacity ahead of actual demand [20] [4].
How can GPU utilization be monitored? At the host level, nvidia-smi and its continuous-monitoring mode (dmon) provide basic readings [13]; for production fleets, NVIDIA's DCGM combined with Prometheus and Grafana, or managed integrations from AWS CloudWatch, Google Cloud's Ops Agent, or Datadog, provide continuous, low-overhead profiling metrics including SM Activity and Tensor Activity [17].
How can GPU utilization be increased? Key techniques include enabling asynchronous data loading with an appropriately sized num_workers and pinned memory [23], adopting mixed precision training on Tensor Core-equipped GPUs [23], tuning batch size upward within memory limits or using gradient accumulation [11], and adopting GPU sharing techniques such as time-slicing and bin-packing at the cluster level [3].
What is sustained GPU utilization in a data center context? It refers to GPU utilization held over an extended training or serving run rather than a single snapshot; benchmark examples above 95 percent sustained utilization exist under the MLPerf Storage benchmark at multi-hundred and multi-thousand GPU scale [9], while typical enterprise fleets sustain far lower averages across mixed workloads [3].
Can 100 percent GPU utilization be a bad sign? Yes; a GPU can report 100 percent utilization while executing a poorly optimized or memory-copy-bound kernel, since the metric only measures whether any kernel was active, not how efficiently the GPU's compute units were used [14].
Conclusion
The question of what constitutes a good GPU utilization percentage does not have a single numeric answer, and any report claiming otherwise oversimplifies a metric that behaves differently across gaming, creative rendering, AI training, and AI inference. The evidence supports a workload-specific framework: for dedicated AI training, NVIDIA says DCGM SM Activity of 0.8 or greater is necessary, but not sufficient, for effective GPU use, while a value below 0.5 likely indicates ineffective use. This is not a universal nvidia-smi GPU-utilization target. For AI inference, 40 to 70 percent can be a normal outcome under low concurrency, and for consumer gaming and productivity workloads, the useful level depends on the application and performance objective.
The more consequential finding in this research is the size of the gap between that achievable target and what most organizations actually measure. Academic research and practitioner surveys spanning 2019 through 2026, alongside Cast AI's vendor-published 2026 telemetry measurement showing a 5 percent enterprise-wide average, point in the same direction. Vendor-published MLPerf Storage simulations and Cast AI's remediation case studies suggest that workload-specific improvements can come from techniques such as asynchronous data loading, appropriately sized batches, GPU sharing, and bin-packing. Meta's Llama 3 disclosure separately illustrates how topology-aware scheduling and network tuning can improve collective-communication performance; it does not establish an equivalent GPU-utilization result.
As GPU capacity becomes simultaneously more expensive and more central to enterprise AI strategy, as reflected in Gartner's $401 billion spending estimate and the reversal of two decades of falling cloud-compute prices, the cost of treating GPU utilization as an afterthought will only grow. Organizations that adopt the layered monitoring approach described in this report, tracking nvidia-smi-level utilization alongside DCGM's SM Activity and Tensor Activity fields and, where training efficiency is the goal, Model FLOPs Utilization, will be better positioned to distinguish a genuinely well-used GPU fleet from one that merely looks busy on a dashboard.
External Sources (23)
About
GPUSmith
Plan and build private AI compute with GPU Smith. We connect workload requirements with GPU hardware, networking, deployment and operating decisions so your infrastructure fits the work it must perform.
GPU Smith provides independent engineering and research for private AI infrastructure. We help technical buyers and operators reason about GPU workload sizing, hardware selection, procurement, deployment and inference operations, from the compute system to the networking, power and cooling requirements around it.
Start with the workload
Useful infrastructure decisions begin with the models, data, throughput, latency and operating constraints a team actually has. GPU Smith helps connect those requirements with system design and deployment choices. The goal is a privately controlled AI environment whose capacity and operational demands are understood before a purchasing decision.
Hardware and supplier research
Our public reference library covers GPUs, complete systems and networking components. The server-vendor directory and manufacturing research help teams investigate suppliers, compare options and follow sources behind technical claims. We distinguish manufacturer specifications from measured benchmarks and advertised capabilities from tested configurations. Reference pages are research resources, not a live inventory listing or a binding equipment quote.
Deployment and operations
GPU Smith's engineering scope includes infrastructure integration, networking, power, cooling and the practical operation of inference workloads. Our published articles explain the tradeoffs behind deployment, procurement and ongoing operations so teams can ask better questions and document decisions.
Work with GPU Smith
Explore the hardware library, GPU references, networking references and vendor research. Contact GPU Smith with your workloads and deployment constraints to discuss a project and confirm current scope, pricing and availability.
Inclusion of a manufacturer or product in our research does not imply a partnership, certification or endorsement.
Disclaimer
This document is provided for informational purposes only. No representations or warranties are made regarding the accuracy, completeness, or reliability of its contents. Any use of this information is at your own risk. GPUSmith shall not be liable for any damages arising from the use of this document. This content was generated with assistance from artificial intelligence tools, which may contain errors or inaccuracies. Readers should verify critical information independently. All product names, trademarks, and registered trademarks mentioned are property of their respective owners and are used for identification purposes only. Use of these names does not imply endorsement. This document does not constitute professional or legal advice. For specific guidance related to your needs, please consult qualified professionals.