GPUSmith Article
GPU Rack Power Redundancy: Failure Matrix and Capacity
A 2026 engineering guide to GPU rack power redundancy: map PSU inputs to branches and sources, separate boot from full service, and calculate surviving-path headroom with an explicit failure matrix.
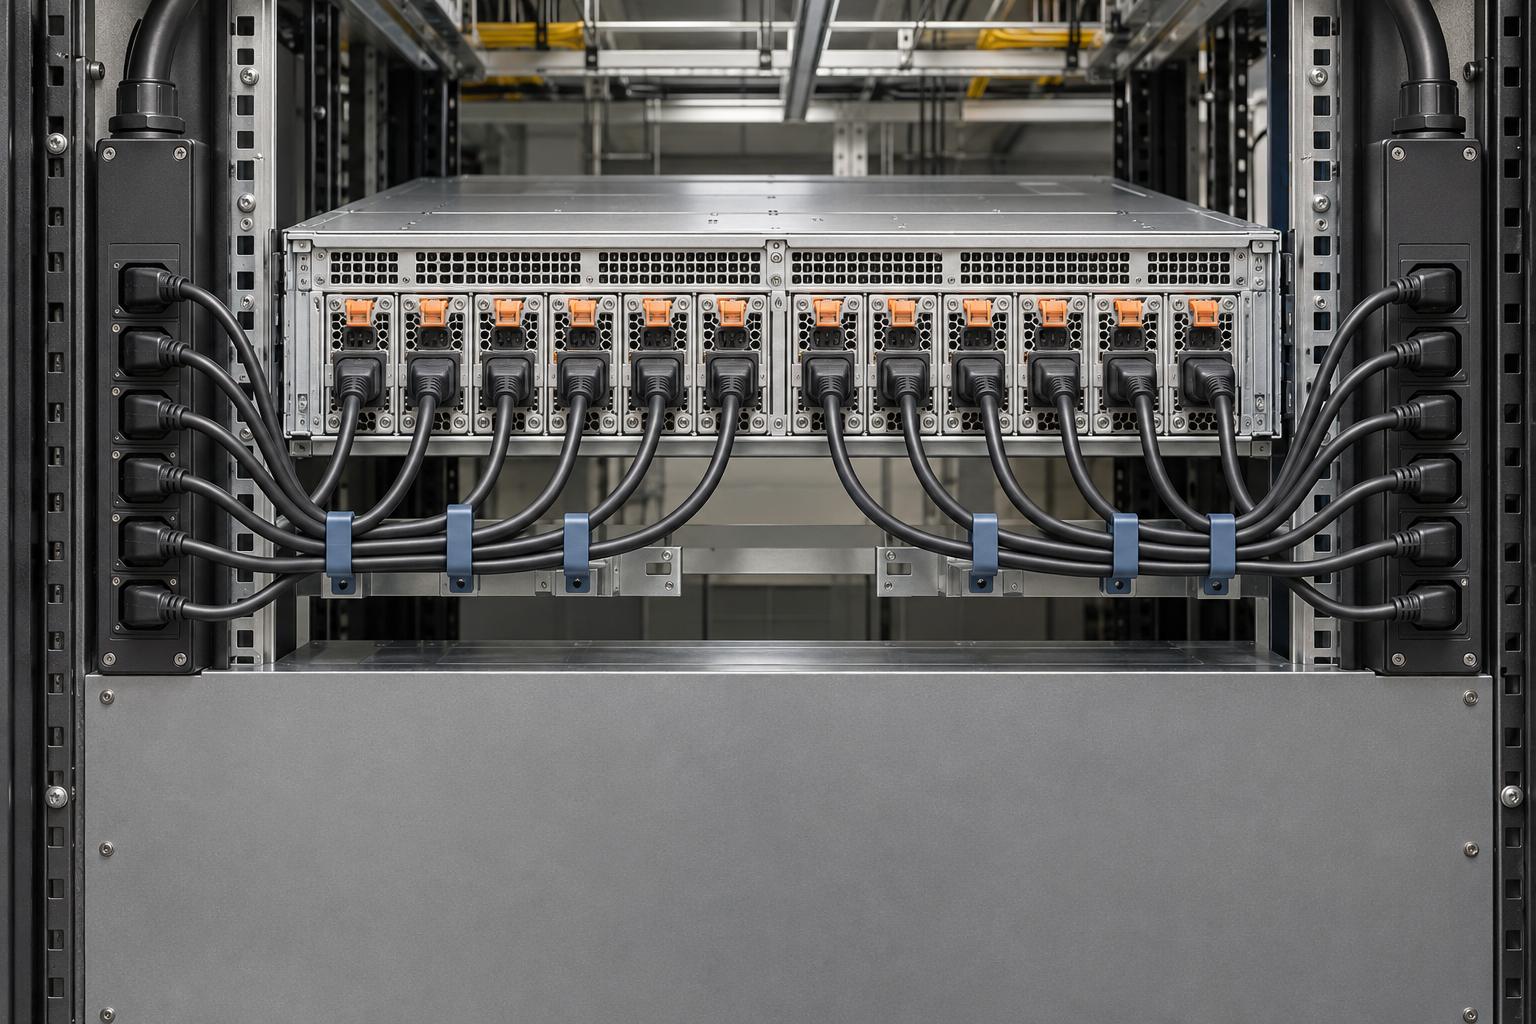
Summary
- 01Prove equipment functionality, contracted service, and surviving-path capacity separately. A PSU redundancy label does not establish all three.
- 02Define approved failure and maintenance events, then trace every server input through its shared upstream components, including required networking and cooling loads.
- 03Apply the exact equipment variant, firmware, power policy, and supported failure combinations. Cold startup, running failover, and restoration need separate evidence.
- 04In the hypothetical rack, surviving inputs satisfy the assumed device rule after a source loss, but the remaining source cannot carry the required demand.
- 05Keep specification conflicts unresolved until the OEM explains the governing revision and measurement boundary. Close acceptance only after workload-qualified testing and report review.
Inside this article
- 01Executive Summary
- 02Introduction and Background
- 03Define the Service Criterion and Approved Events
- 04Build the Server-to-Source Incidence Matrix
- 05Apply the Exact OEM Failure Rules
- 06Calculate Surviving Path and Branch Capacity
- 07Commission and Maintain the Evidence
- 08Data Analysis and Evidence
- 09Implications and Future Directions
- 10Conclusion
Executive Summary
GPU rack power redundancy requires separate proof that graphics processing unit (GPU) equipment remains functional, delivers the required service, and fits within every surviving upstream path. A power supply unit (PSU) label alone cannot establish that result. Redundant infrastructure paths and independent, physically isolated systems are different topology claims; neither supplies the actual server-to-outlet mapping. Begin with the contracted workload, permitted degradation, and the named failure or maintenance event, then trace each powered input through its shared components. [1]
The documented product rules differ materially. DGX B200 has six PSUs in 5+1; its cable-loss table reports an 800 W GPU maximum after two or three cable losses and shutdown after four. DGX B300 alternating-current (AC) instead has twelve supplies in N+N, with six fully functional supplies supporting full capacity. Its busbar version depends on external shelves. These are manufacturer-documented states, not site failover measurements, and booting is a separate acceptance question from sustained full service. [2] [3] [4]
The B300 evidence also requires boundary reconciliation. Its detailed guide lists 15 kilowatts (kW) system maximum, while the best-practices PDF's separate two-system AC pattern lists estimated 30 kW average and 39.4 kW peak demand. Obtain a revision-matched explanation of AC input versus direct-current (DC) output, peripherals, peak duration, and the purchased bill of materials (BOM) before adopting a design limit. Do not multiply installed PSU output ratings into server consumption; Dell expressly distinguishes supply capacity from actual delivered load. [4] [5] [6]
The worksheet below combines an input-path map, a specification-conflict register, and an event-capacity matrix. Its explicitly hypothetical rack requires 26 kW, normally split 13 kW per source; after either source is lost, the survivor requires 26 kW against an assumed 24 kW usable limit, leaving −2 kW headroom despite sufficient surviving inputs. This illustrates the load shift described by Vertiv, not a measured deployment. Final acceptance needs authorized, workload-qualified integrated testing and reviewed reports, consistent with ASHRAE's commissioning framework. [7] [8]
Introduction and Background
GPU rack power redundancy is a service claim that must be proved across a complete power path. A server can remain energized while its workload loses performance; a server can retain adequate conversion capacity while its surviving branch or source lacks sufficient electrical capacity. The acceptance question is therefore whether the actual mapping preserves the contracted service during each approved failure or maintenance event. Uptime Institute's distinction between redundant distribution paths and independent, physically isolated systems helps explain why labels at different infrastructure layers answer different questions. [1]
This report treats the rack as a collection of dependent loads rather than a sum of power supply unit (PSU) nameplates. It provides a design-review and commissioning worksheet, not an electrical installation procedure. The workload boundary includes any networking or cooling equipment required to deliver the service. Continuous cooling is explicitly part of Uptime Institute's fault-tolerant infrastructure description; electrical survival alone does not prove service continuity. [1]
For an independent engineering advisor such as GPU Smith, the useful deliverable is an auditable acceptance matrix: the bill of materials (BOM), the connected paths, the documented equipment rules, the required load, and the remaining evidence gaps. Procurement language should state the required service rather than merely request “redundant power.” Cisco's documentation, for example, distinguishes grid-redundant and non-redundant power policies, illustrating why installed hardware and configured behavior must both enter the review. [9]
The discussion is anchored to documents retrieved on November 3, 2026. Published equipment specifications establish documented behavior, not measured behavior at a particular site. ASHRAE distinguishes functional testing of individual systems from integrated testing of interacting systems; the handoff should preserve that distinction. The hypothetical calculations below demonstrate the worksheet method and supply no site rating or measured benchmark. [8]
Define the Service Criterion and Approved Events
Start with a written service objective. “The server stayed on” leaves the engineering decision incomplete. The worksheet should distinguish these acceptance classes:
- Powered survival: the required device remains operating, with the permitted functions explicitly stated.
- Degraded service: a documented power cap or other reduced operating mode is acceptable within a specified workload limit.
- Full service: the agreed throughput, latency, availability, and supporting infrastructure remain within the contract's acceptance criteria.
- Recovery: the equipment returns to the required state within the allowed recovery window, if uninterrupted operation is not required.
These are proposed acceptance categories, not vendor performance guarantees. Their value is to prevent a documented reduced-power mode from being accepted as full capacity. Power policy can change the capacity available after a fault: Cisco documents that a failed supply removes its contribution to Extended Power mode. The corresponding policy and firmware settings therefore belong beside the hardware identity in the worksheet. [10]
Define the approved event set before counting surviving PSUs. Loss of a supply, loss of a branch, loss of an entire feed, and planned upstream maintenance are different events. A feed outage followed by another PSU failure is a compound event. It should receive a separate row if the contract requires it, rather than being hidden inside a generic single-failure claim. Cisco's grid-redundant chassis guidance explicitly calls for separate facility sources and cabling, supporting the need to describe the event's actual upstream boundary. [10]
For each event, record:
- Initiator: the named component or maintenance boundary made unavailable.
- Duration: the required service period and any permitted interruption.
- Starting state: normal operation, a pre-existing maintenance state, or another explicitly approved condition.
- Workload: the required service envelope and permitted degradation.
- Dependencies: the networking, controls, and cooling needed to deliver that service.
- Disposition: accepted, rejected, or unresolved pending named evidence.
Treat cold startup, running failover, and restoration as distinct questions. The Open Rack specification separately addresses automatic rectifier recovery after an alternating-current (AC) failure, illustrating that restoration behavior deserves explicit evidence rather than inference from a steady-state redundancy label. A running-system result should not automatically close a cold-start requirement. [11]
Finally, keep the acceptance statement local to the evidence. A facility topology designation provides useful context, but the rack worksheet still needs its own connected-load proof. Uptime Institute describes redundant capacity and distribution at the infrastructure level; it does not supply the missing server-to-outlet assignment for an individual installation. [1]
A server can remain energized while its workload loses performance; a server can retain adequate conversion capacity while its surviving branch or source lacks sufficient electrical capacity.
Build the Server-to-Source Incidence Matrix
The power-path incidence matrix identifies which inputs depend on each shared component. A row represents a physical input; a column identifies an outlet, branch, rack power distribution unit (PDU), upstream protective device, uninterruptible power supply (UPS), or source. An event removes the affected columns and every input dependent on them. Redfish provides standardized links to outlets supplying a chassis or PSU, which can help populate this record where the equipment implements those links. Physical verification remains a separate commissioning task. [12]
Inventory the exact server variant and stock keeping unit (SKU), PSU model, power-shelf model, firmware, power policy, and input rating. Record cord identity, outlet identity, phase connection, branch identity, and the upstream chain. Connector compatibility also belongs in the record: a recognizable connector family does not establish the permitted circuit loading or the equipment's voltage-qualified output. (Source: www.legrand.us) [13]
Table 1 gives an illustrative input map for the first server in the later Hypothetical Example. Every number and identifier in this table is an author-defined assumption. Each arrow maps one input to one distinct outlet. A second server requires its own complete map; it must not inherit an assumed copy.
| Inputs and individual outlets | Assumed phase connection | Branch | Rack PDU | Upstream chain |
|---|---|---|---|---|
| PSU1 → A1.01; PSU2 → A1.02 | L1 to neutral | A1 | PDU-A | Panel-A → UPS-A → Source-A |
| PSU3 → A1.03; PSU4 → A1.04 | L2 to neutral | A1 | PDU-A | Panel-A → UPS-A → Source-A |
| PSU5 → A1.05; PSU6 → A1.06 | L3 to neutral | A1 | PDU-A | Panel-A → UPS-A → Source-A |
| PSU7 → B1.01; PSU8 → B1.02 | L1 to neutral | B1 | PDU-B | Panel-B → UPS-B → Source-B |
| PSU9 → B1.03; PSU10 → B1.04 | L2 to neutral | B1 | PDU-B | Panel-B → UPS-B → Source-B |
| PSU11 → B1.05; PSU12 → B1.06 | L3 to neutral | B1 | PDU-B | Panel-B → UPS-B → Source-B |
The table makes shared dependencies visible. The example assumes the upstream chains are independent through the declared event boundary. In a real review, different A/B outlet labels cannot establish that assumption: both chains must be traced to their common points. Cisco's separate-source and separate-cabling guidance is a useful equipment-specific illustration of this requirement. [10]
A pair of PSU inputs may share a branch even when connected to different outlets. Conversely, a failed outlet or cord need not remove the entire branch. Record the protection and connection topology at the resolution needed to distinguish those events. Monitoring at the inlet, branch, and outlet provides different visibility; the worksheet should identify the boundary of every reading used in its calculations. [14]
Shared single-cord loads require particular attention. A transfer switch may provide an alternative source path, but its voltage, transfer behavior, load compatibility, and surviving capacity still require evidence. A dual-fed server cannot compensate for a required switch or cooling controller whose available power path has disappeared. [15]
Retain a dated mapping export or signed connection schedule with the worksheet. Outlet connectivity represented in a management interface is useful evidence, but its interpretation should be tied to the implemented schema, actual cabling, and equipment identity. An empty or unsupported connectivity field is an unresolved mapping item. [12]
Apply the Exact OEM Failure Rules
N+1 describes a spare conversion unit beyond the units needed for a declared load; N+N describes a duplicated required set. Neither label identifies the upstream components shared by the inputs. The Open Rack Standard's rectifier requirements, for example, address redundancy and parallel load sharing within a shelf architecture. The worksheet must add the actual distribution topology. [11]
The NVIDIA DGX B200 documents six PSUs in 5+1. [2] Its cable-loss table reports no system effect after one cable is removed, baseboard management controller (BMC) AC-loss alerts and a reported 800 W GPU maximum after two or three removals, and shutdown after four. [2] These are documented product states, not measured rack failover results. A half-and-half feed assignment therefore cannot inherit a full-service claim from the PSU label.
The DGX B300 alternating-current (AC) variant instead documents twelve supplies in N+N. Its introduction distinguishes a minimum requirement of six from a boot threshold of three operational supplies. The service manual explicitly supports full capacity with six fully functional supplies. The direct-current (DC) busbar variant uses external power shelves rather than that integrated AC topology. Confirm the supported failed-input combinations instead of converting a count into an arbitrary-combination guarantee. [4] [3] [4]
Other manufacturers illustrate why this rule must remain SKU-specific. Dell PowerEdge XE9680 documentation says its management controller's A/B Grid Redundant setting is unsupported. Lenovo's ThinkSystem SR680a V4 specifies N+1 for its 3200 W architecture with six or eight supplies, while its N+N option requires the documented 3800 W configuration and input above 249 VAC or 260 VDC within its supported ranges. These examples cannot be substituted for DGX behavior. [6] [13]
Keep a Specification Conflict Register
Table 2 records unresolved boundaries in the opened B300 material. These entries are reasons to obtain a revision-matched original equipment manufacturer (OEM) response before accepting a design limit.
| Evidence item | What the opened source states | Required disposition |
|---|---|---|
| B300 introduction, overview versus detailed power tables | Overview: 14.5 kW consumption and twelve 3.2 kW supplies. Detailed table: 15 kW system maximum and 3.3 kW per supply. [4] | Ask which values govern the purchased BOM and operating boundary. |
| B300 best-practices PDF, two-system AC pattern | Estimated demand values: 30 kW average and 39.4 kW peak. [5] | Obtain definitions of average, peak, duration, peripherals, and AC-input versus DC-output boundary. |
| Same PDF, four-system DC pattern | Four 33 kW shelves; N+1 shelf redundancy separately from 2N circuit inputs per shelf. [5] | Evaluate shelf loss and upstream circuit loss as separate events. |
| Document identity | Reader-extracted title says B200; first-page document text says B300. [5] | Preserve the exact file and confirm the applicable document revision. |
The table does not reconcile the values by selecting the convenient figure. The PDF's rack-table footnote explicitly identifies the demand figures as estimates and says actual specifications may vary. [5] Obtain a revision-matched OEM explanation of their boundary before adopting them as design limits. No site measurements in this report resolve the discrepancy.
Record the answer against the actual BOM, firmware, voltage, included peripherals, and transient definition. Also preserve evidence quality: an opened ServeTheHome walkthrough expressly states that its ASUS unit was not in its test lab. That observation must not be described as measured DGX failover validation. [16]
- Six PSUs configured as 5+1.
- The cable-loss table reports an 800 W GPU maximum after two or three removals and shutdown after four.
- A half-and-half feed assignment cannot inherit a full-service claim from the PSU label.
- Twelve supplies configured as N+N.
- The introduction distinguishes six required supplies from a three-supply boot threshold; the service manual supports full capacity with six fully functional supplies.
- The DC busbar variant uses external power shelves and requires its own topology review.
These are documented product states, not measured site failover results. Confirm supported failed-input combinations rather than treating a supply count as an arbitrary-combination guarantee.
Calculate Surviving Path and Branch Capacity
For each event, complete the device-state check before the upstream capacity check. Count surviving supported supplies or shelves, apply the documented full/degraded/shutdown rule, and determine the required device input envelope. PSU nameplate output is not server consumption: Dell explicitly distinguishes rated capacity from power delivered according to system needs. [6]
Keep kilowatts (kW) of real power, kilovolt-amperes (kVA) of apparent power, input current, and direct-current (DC) output separate. Power factor (PF) relates real and apparent power; a UPS can have different kW and kVA ratings. Both constraints belong in the capacity record rather than being collapsed into one nominal rating. [17] [18]
At a declared, consistent boundary, use:
- Surviving-path demand: sum of the required device input loads assigned to that path in the event, plus all required auxiliary loads.
- Usable capacity: the approved limit for that exact path under the approved design and operating conditions.
- Headroom: usable capacity minus the worst required surviving-state demand.
- Disposition: pass only when the service rule and every relevant capacity constraint pass; otherwise fail or remain unresolved.
These are worksheet definitions. They require evidence for load allocation: Dell's hot-spare guidance shows that almost all load can be placed on active supplies, so equal sharing cannot be presumed from the number of connected cords. If behavior is unknown, calculate a supported interval and request OEM confirmation. [19]
Conversion losses require the same care. Efficiency is useful output divided by total input; if the qualified load is DC output, AC input depends on the applicable efficiency. Keysight recommends matching load and environmental conditions when recording input and output measurements. Do not add a conversion loss to a value already measured at the AC input boundary. [20]
For a balanced three-phase AC-input case only, the current relation is:
I = P / (√3 × V_LL × PF)
Here P is real input power in watts, V_LL is line-to-line voltage, and I is line current. PPL Electric Utilities publishes the corresponding three-phase kW-to-current relationship. A lower PF requires more current for the same useful power. [17] [21]
Unbalanced branches require the actual connection topology and measured phase quantities. Yokogawa explains that accurate unbalanced-load calculations use all phase voltages and currents, while Raritan notes that imbalance can strand PDU capacity. A passing aggregate kW result cannot close a phase-current constraint. [21] [22]
Apply the confirmed outlet, cord, branch, PDU, UPS, and source limits, including voltage and environmental qualifications. Lenovo documents reduced PSU output at a lower supported input voltage. Schneider distinguishes standard-rated and continuously rated breaker applications in its US guidance; this does not establish a universal derating factor for every installation. The responsible electrical engineer must identify the approved usable limit under the applicable design and jurisdiction. [13] [23] [24]
In a Hypothetical Example, assume 26 kW total real input, balanced 400 V line-to-line, and PF = 0.98. Calculated line current is 26,000 / (√3 × 400 × 0.98) = 38.3 A, rounded. These are reader assumptions and a derivation, not an approved breaker selection. [17]
If a branch becomes unbalanced, replace that simplified representation with phase measurements and the actual wiring model. Yokogawa describes summing phase wattmeter measurements for three-phase four-wire power, and Fluke recommends balancing panelboard loads across phases. Retain both aggregate demand and the worst phase constraint in the acceptance record. [21] [25]
Commission and Maintain the Evidence
Commissioning should convert the approved worksheet into a controlled evidence plan. ASHRAE distinguishes testing individual systems from integrated testing under operating and failure scenarios. The relevant evidence must demonstrate the required workload and the interacting electrical, cooling, and networking dependencies, rather than merely record that an alarm appeared. [8]
Before an authorized site or vendor test, establish:
- Authority and scope: the approved event, responsible personnel, maintenance boundary, and restoration authority.
- Prerequisites: accepted mapping, qualified equipment configuration, required cooling, network availability, and baseline health.
- Service criteria: the workload, throughput or latency objective, duration, and permitted degradation.
- Expected behavior: surviving inputs, documented alarms, expected power limits, and any unresolved OEM condition.
- Instrumentation: measurement boundaries, channel identities, sampling capability, timestamps, and recorded workload telemetry.
- Restoration and disposition: expected recovery state, evidence owner, acceptance decision, and unresolved items.
This is an evidence checklist, not a procedure for manipulating energized equipment. The plan should be prepared and executed by the authorized site and vendor teams. Site-specific standards selection remains the specifier's responsibility; the article supplies neither an installation design nor a universally applicable electrical-code interpretation. [24]
Use measurements that answer the failure-state question. Raritan documents measurement at PDU inlets, outlets, and circuit breakers, including current and power-related quantities. These channels can support different parts of the worksheet, but their capabilities must be confirmed for the installed model. A server's output-power telemetry alone does not measure the AC demand seen by an upstream branch. [14] [12]
Preserve both transition evidence and sustained-load evidence. Peak and minimum/maximum recording can supplement steady readings where supported; a point-in-time imbalance calculation cannot describe all changing conditions. Identify the recording duration and resolution before deciding what a successful trace proves. [14] [25]
Correlate physical power measurements with device health and workload behavior. Dell documents historical power consumption and PSU-status data through its management controller. DMTF separately defines measured input power and output power, allowing the evidence register to state which boundary a particular telemetry field represents. [19] [12]
Also distinguish continued management visibility from continued load power. Panduit's Power Share description preserves sensor monitoring and electronic rack access after a feed loss; those management functions do not establish that the IT load remains powered. An acceptance report should identify exactly what each observation demonstrates. [26]
Do not close a failed capacity row merely by proposing a software cap. Dell notes that caps can temporarily be exceeded during high demand. Any proposed cap must also preserve the contracted workload and receive the appropriate sustained and transition validation. Reducing the required service changes the acceptance case; it does not prove the original full-service objective. [19]
Collect and review the test reports before closing the acceptance item. ASHRAE identifies receipt and review of reports as a hold point. Retest or reopen the affected rows after a hardware, firmware, power-policy, outlet-assignment, or service-load change; retain the earlier result as evidence for its original configuration. [8]
Data Analysis and Evidence
Surviving-Source Calculation (Hypothetical Example)
All quantities in this example are reader assumptions, not OEM specifications, measurements, or recommended ratings. Assume servers S1 and S2 each have twelve supported inputs, with six assigned to each independent source. For this invented equipment configuration, assume the OEM has confirmed that any six surviving inputs preserve the declared full service. Neither this assumption nor the numerical load applies automatically to DGX.
Assume each server requires 12 kW at its AC input boundary for the qualified workload. Required dual-fed auxiliary equipment consumes 2 kW in total. Normal sharing is assumed equal across the sources. Each source has 24 kW approved usable capacity, each server branch has 15 kW approved usable capacity, and the auxiliary paths have separately confirmed sufficient limits. All remaining outlet, cord, phase, protection, cooling, and network limits are assumed independently confirmed. Demand envelopes are assumed to include the required sustained and transient behavior. These assumptions deliberately avoid multiplying PSU output ratings into server demand, consistent with Dell's distinction between rated supply capacity and delivered load. [6]
The source calculations are therefore:
- Total required input: 12 + 12 + 2 = 26 kW.
- Normal demand per source: 26 / 2 = 13 kW.
- Normal source headroom: 24 − 13 = 11 kW.
- Demand after either complete source loss: 26 kW on the survivor.
- Surviving-source headroom: 24 − 26 = −2 kW.
These are arithmetic results of the stated assumptions. The load-shift mechanism is consistent with Vertiv's explanation that the remaining PDU may carry the entire rack demand after a source loss. A positive normal margin therefore does not establish a positive surviving-state margin. [7]
Table 3 separates the equipment decision from the path decision. Branch A1 supplies S1's A-side inputs; the other server has separate branches A2 and B2. The single-PSU row retains uncertainty rather than inventing a sharing policy.
| Event | Surviving inputs, S1/S2 | Required A/B demand, kW | Limiting-path comparison | Service disposition |
|---|---|---|---|---|
| Normal | 12 / 12 | 13 / 13 | Each source: 13 against 24 | Pass under the assumptions. |
| Loss of A | 6 / 6 | 0 / 26 | B: 26 against 24; headroom −2 | Device rule passes; source capacity fails. |
| Loss of B | 6 / 6 | 26 / 0 | A: 26 against 24; headroom −2 | Device rule passes; source capacity fails. |
| Branch A1 lost | 6 / 12 | 7 / 19 | B: 19 against 24; S1 branch B1: 12 against 15 | Pass under the assumed sharing and limits. |
| S1 PSU1 unavailable | 11 / 12 | Each source bounded at 7 to 19 | Worst source bound: 19 against 24 | Capacity bound passes; sharing behavior remains to be confirmed. |
| A lost plus an S1 B-side PSU unavailable | 5 / 6 | Full-service allocation undefined | S1 falls below assumed supported minimum | Compound-event full service fails before path acceptance. |
The feed-loss rows answer different questions with different results: the assumed equipment can provide full capacity, but the source cannot support its required demand. The branch-loss row passes because only one server transfers its entire load. The compound row is not a single-component result. Its workload cannot be credited at full service once its assumed equipment condition fails.
In the single-PSU row, S2 and the auxiliaries retain their assumed normal allocation, contributing 7 kW per source. S1's unknown allocation is bounded between zero and its entire 12 kW on either source, producing the 7 to 19 kW interval. The two upper bounds cannot occur simultaneously. Equal remaining-PSU sharing would narrow the interval, but Dell's documented active/standby behavior illustrates why a sharing assumption requires evidence. [19]
Implications and Future Directions
The principal procurement implication is that a redundancy label should be accompanied by a failure-state capacity submittal. Request the connected-input map, supported failure combinations, documented degraded modes, qualified load boundary, and surviving-path calculations. The difference between grid-redundant and non-redundant settings in Cisco's guide illustrates why that submittal must identify the effective power policy, not just the installed PSU count. [9]
For colocation operators, the practical acceptance boundary is the contracted service and the power paths actually allocated to it. Rack-level loads must include required auxiliary equipment and any transfer mechanism for single-cord devices. Eaton documents automatic transfer switch (ATS) rack PDUs for equipment with a single supply; using such a device introduces another component whose applicable behavior and capacity need evidence. [15]
For commissioning teams, the matrix provides a stable way to preserve uncertainty. An unknown load-sharing policy becomes a bounded calculation and an OEM action item. An unexplained specification boundary becomes an unresolved design input. A failed test becomes a disposition against a named configuration and event. Report review remains necessary even when execution has been reported complete. [8]
More structured connectivity and telemetry can reduce manual reconciliation. Redfish outlet links can represent relationships, while separate supply input/output properties can preserve measurement boundaries. Neither feature proves that the installed implementation exposes complete, accurate data. Retain the physical mapping and version-qualified evidence alongside automated exports. [12]
The handoff should include a concise unresolved-evidence register:
- OEM behavior: supported combinations, boot versus sustained operation, power policy, and restoration.
- Specification boundary: governing revision, AC input, DC output, peripherals, and peak duration.
- Facility capacity: approved path limits, phase assignment, source independence, and shared protection.
- Service proof: required workload, dependency continuity, measured results, and acceptance authority.
- Change control: the configuration changes that reopen each accepted row.
The governing standards and approved design also need to remain current. HSE explicitly advises checking that an electrical standard in use is current; a preserved worksheet should identify its applicable references rather than carry forward an unexplained loading factor. [24]
Conclusion
- 01Declare service
State the required service and approved event set.
- 02Trace inputs
Map each input through its shared upstream dependencies.
- 03Apply equipment rules
Use the exact equipment and configuration rules.
- 04Calculate capacity
Calculate demand and headroom at matched boundaries.
- 05Validate evidence
Validate the approved case and retain its evidence.
- 06Reopen changed rows
Reopen affected rows when the configuration changes.
GPU rack power redundancy is established by the combination of a service criterion, an actual connection map, documented equipment behavior, and surviving-path capacity. No individual label closes all of those questions. Redundant distribution, redundant conversion, and integrated system operation require different evidence. The separation between individual functional testing and integrated testing provides a useful structure for the final acceptance record. [8]
The working sequence is straightforward:
- Declare the service and the approved event set.
- Trace each input through its shared upstream dependencies.
- Apply the exact equipment and configuration rules.
- Calculate demand and headroom at matched boundaries.
- Validate the approved case and retain its evidence.
- Reopen affected rows when the configuration changes.
The hypothetical example shows the consequence of this discipline: sufficient surviving inputs can coexist with insufficient source capacity. Its arithmetic is a worksheet demonstration, not a site limit. Equal normal sharing should never substitute for a supported failure-state allocation; the documented possibility of active/standby loading makes that evidence requirement concrete. [19]
An engineering handoff is complete when every required row has an accepted disposition or an explicit unresolved owner. Equipment functionality, full-service capacity, and upstream capacity should remain separate fields through design review and commissioning. The final decision should follow the reviewed evidence, with unresolved specification boundaries carried forward until the responsible OEM or site team closes them. ASHRAE's report-review hold point supports that final discipline. [8]
External Sources (26)
About
GPUSmith
Plan and build private AI compute with GPU Smith. We connect workload requirements with GPU hardware, networking, deployment and operating decisions so your infrastructure fits the work it must perform.
GPU Smith provides independent engineering and research for private AI infrastructure. We help technical buyers and operators reason about GPU workload sizing, hardware selection, procurement, deployment and inference operations, from the compute system to the networking, power and cooling requirements around it.
Start with the workload
Useful infrastructure decisions begin with the models, data, throughput, latency and operating constraints a team actually has. GPU Smith helps connect those requirements with system design and deployment choices. The goal is a privately controlled AI environment whose capacity and operational demands are understood before a purchasing decision.
Hardware and supplier research
Our public reference library covers GPUs, complete systems and networking components. The server-vendor directory and manufacturing research help teams investigate suppliers, compare options and follow sources behind technical claims. We distinguish manufacturer specifications from measured benchmarks and advertised capabilities from tested configurations. Reference pages are research resources, not a live inventory listing or a binding equipment quote.
Deployment and operations
GPU Smith's engineering scope includes infrastructure integration, networking, power, cooling and the practical operation of inference workloads. Our published articles explain the tradeoffs behind deployment, procurement and ongoing operations so teams can ask better questions and document decisions.
Work with GPU Smith
Explore the hardware library, GPU references, networking references and vendor research. Contact GPU Smith with your workloads and deployment constraints to discuss a project and confirm current scope, pricing and availability.
Inclusion of a manufacturer or product in our research does not imply a partnership, certification or endorsement.
Disclaimer
This document is provided for informational purposes only. No representations or warranties are made regarding the accuracy, completeness, or reliability of its contents. Any use of this information is at your own risk. GPUSmith shall not be liable for any damages arising from the use of this document. This content was generated with assistance from artificial intelligence tools, which may contain errors or inaccuracies. Readers should verify critical information independently. All product names, trademarks, and registered trademarks mentioned are property of their respective owners and are used for identification purposes only. Use of these names does not imply endorsement. This document does not constitute professional or legal advice. For specific guidance related to your needs, please consult qualified professionals.