GPUSmith Article
RTX PRO 6000 Server Edition vs L40S: Inference Cost
Summary
- 01Server Edition's larger per-device memory can change inference economics when it removes a concrete constraint in model weights, concurrent KV cache, multiple services or long-context bursts.
- 02A model's weights fitting on L40S does not establish useful concurrent capacity. Memory planning must also include KV cache, runtime workspace and allocation margin.
- 03Two L40S cards provide separate memory allocations. Their serving runtime must distribute the workload, and communication and stage balance affect the result.
- 04At equal occupancy, quality and service requirements, Server Edition lowers cost only when its measured goodput ratio exceeds its fully loaded cost ratio.
- 05The article establishes no actual cost-per-token winner: buyer quotes and matched hardware measurements are missing. Its cost examples are hypothetical, and published provider results guide testing.
Inside this article
Executive Summary
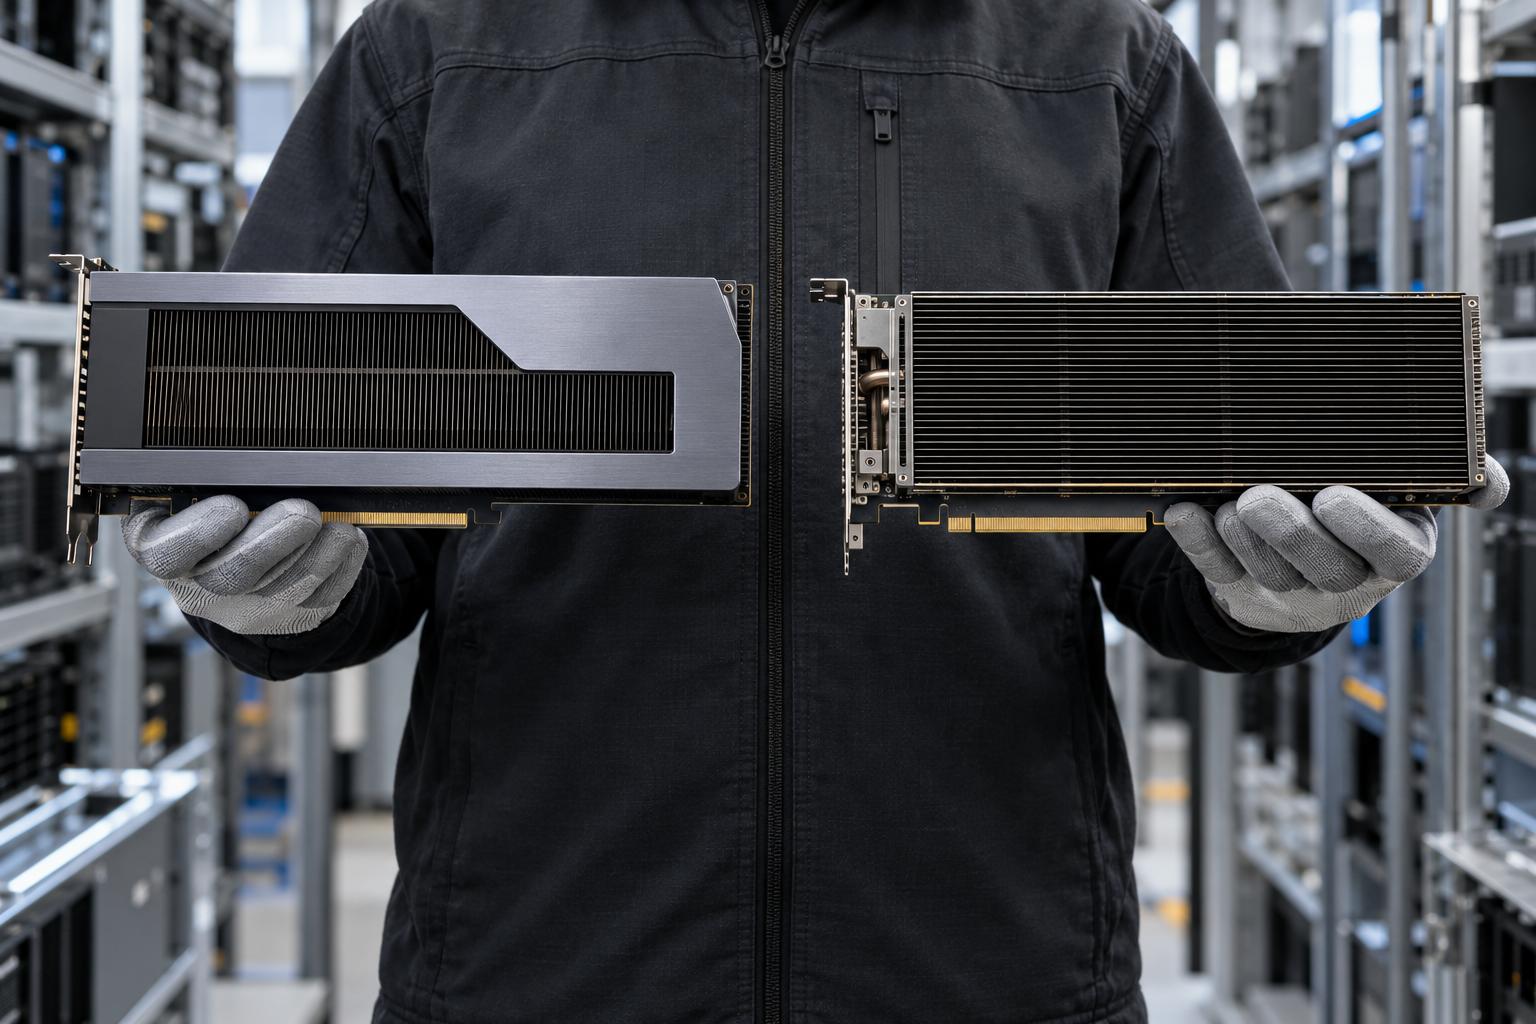
RTX PRO 6000 Blackwell Server Edition vs L40S is a model-capacity and system-economics decision. As checked on October 24, 2026, NVIDIA specifies 96 GB graphics double data rate 7 (GDDR7) memory, 1,597 GB/s memory bandwidth and configurable maximum power up to 600 W for Server Edition. [1] L40S specifies 48 GB graphics double data rate 6 (GDDR6) memory, 864 GB/s and 350 W, with neither Multi-Instance GPU (MIG) nor NVLink support. [2] Those specifications establish capacity, interfaces and power envelopes. They do not establish application throughput, response latency or cost per token.
For private large language model (LLM) inference, the important question is whether additional memory removes a serving constraint. Meta's Llama 3.1 architectures provide a concrete comparison: the nominal 8B and 70B models use grouped-query attention, which reduces key-value head count relative to query heads. [3] Calculations from the published architecture give 1 gibibyte (GiB) and 2.5 GiB of sixteen-bit key-value (KV) cache respectively for each sequence containing 8,192 resident tokens, before allocation overhead. [4] The worked planning example puts quantized 70B weights, runtime reserve and eight such sequences at 64 GiB. This is an analytical budget, not an observed engine footprint. A weights-only fit on L40S therefore cannot establish useful concurrent capacity.
The purchase threshold is simple: at equal output quality, workload and service-level objectives (SLOs), Server Edition lowers cost only when its measured goodput ratio exceeds its fully loaded hourly-cost ratio. Goodput counts output tokens from requests meeting the stated latency and completion requirements. Serving research distinguishes time to first token (TTFT) from time per output token (TPOT), because both constrain useful capacity. [5] Published provider measurements can guide testing, but Packet.ai's single-card results and Dell's precision-dependent comparisons do not supply the matched buyer experiment specified here. [6] [7]
This report proposes an 80% 8B / 20% 70B request mix, controlled quantization, explicit prompt distributions and separate latency limits. Its cost illustration is deliberately hypothetical: three-year totals of $30,000, $45,000 and $48,000 imply Server Edition crossover ratios of 1.60 against one L40S and 1.067 against two. These are arithmetic scenarios, not supplier quotes or performance claims. Procurement should replace them with complete system quotes and metered energy inputs. MLCommons measures full-system benchmark power at the wall; the same boundary is appropriate here. [8] Keep L40S when it meets capacity and SLO requirements economically; evaluate Server Edition where memory, consolidation or operating cost justifies a measured advantage.
Introduction and Background
A private inference fleet needs to deliver an agreed answer quality within an agreed response time. A card with more memory can accommodate additional model weights, longer requests or more simultaneous sequences. Which benefit matters depends on the application. Cache contains keys and values for every attention layer, and its sequence dimension grows during generation, so prompt length alone understates memory demand. [9]
This report addresses enterprise architects and procurement teams choosing among keeping an existing L40S deployment, expanding it, using a pair of L40S cards for a larger model, or purchasing Server Edition. The distinction between reuse and expansion matters: an installed system's historical purchase price does not represent the cash required for another server. Both a forward-looking cash comparison and a consistent replacement-cost comparison should be prepared, without mixing their boundaries.
GPU Smith's position in this discussion is that of an adjacent engineering advisor. The assessment concerns third-party hardware and a reproducible procurement method; it does not present consultancy delivery claims as evidence. The report uses primary specifications checked during this research session, explicit analyst assumptions and attributed provider observations. It contains no measurements made on the compared hardware.
Three serving scenarios organize the analysis:
- Single large model: a quantized 70B service with enough cache for the intended simultaneous requests.
- Several smaller models: independent 8B services, with separate memory reservations, load patterns and scheduling policies.
- Long-context burst: requests that sharply increase resident cache, even when daily average traffic is modest.
The chosen model family has nominal 8B and 70B options and a published long-context capability, but a model's advertised context limit is distinct from economical fleet capacity. [3] The baseline below deliberately uses shorter operating windows and a separate burst test. Organizations serving 13B models should substitute their actual architecture and checkpoint size; interpolating only by parameter count misses differences in attention layout and cache demand. The capacity model therefore precedes the performance comparison.
RTX PRO 6000 Blackwell Server Edition
Capabilities
The Server Edition stock keeping unit (SKU) combines the specified 96 GB memory capacity with server deployment options. NVIDIA documents an air-cooled, dual-slot full-height full-length option and a liquid-cooled, single-slot full-height extended-length option. These are different physical integration choices, not interchangeable cooling descriptions for any board advertised as RTX PRO 6000. [1]
MIG supplies a further configuration choice. NVIDIA's current profile table lists 1g.24gb, 2g.48gb and 4g.96gb configurations, with maximum counts of four, two and one respectively. [10] Partitioning can help divide capacity among services, but a smaller partition also reduces the memory available to each model. An isolated partition cannot make a larger checkpoint fit its own budget, and hardware resource partitioning does not establish an application-level security policy.
Adoption
Original equipment manufacturer (OEM) platforms provide concrete evidence of supported integration rather than universal compatibility. HPE's DL385 Gen11 page states support for two RTX PRO 6000 and 4500 GPUs. [11] Supermicro describes a portfolio thermally optimized for air-cooled environments. [12] Those offerings establish system options to quote; their existence does not establish the required fan arrangement, processor configuration or rack conditions for an existing fleet.
Strengths and Limitations
A larger per-device allocation can avoid splitting one memory-constrained model across cards. That simplification is valuable only if the selected checkpoint, cache and runtime fit with operating margin. Software support also needs a recorded configuration: NVIDIA's MIG prerequisites specify CUDA 12 and an R575 minimum driver of 575.51.03 for the relevant RTX PRO entries. [13]
The acceptance checklist should capture:
- Exact option: board part number, Server Edition designation, power cap and cooling assembly.
- Platform approval: server model, processors, riser, power supplies, fan configuration and supported GPU population.
- Software provenance: driver, firmware, serving-engine build, container digest and selected kernels.
- Partition policy: required profile, scheduling configuration and the actual deployment's license terms.
NVIDIA's documented Blackwell vGPU-for-Compute configuration requires NVIDIA AI Enterprise. That is a deployment-specific licensing statement, not evidence that every bare-metal MIG use requires the same license. [14] Obtain a quote for the intended deployment rather than copying a license assumption from another virtualization arrangement.
NVIDIA L40S
Capabilities
L40S remains a 48 GB data-center option with passive cooling and a 350 W specified maximum board power. Its published interface is Peripheral Component Interconnect Express (PCIe) Gen4 x16; NVIDIA lists no NVLink or MIG support. [2] Its resource-sharing design therefore differs from a MIG-partitioned Server Edition deployment, even when both can host the same application containers.
An L40S fleet should first be assessed against its actual workload. If a checkpoint, cache and runtime fit, and requests meet latency requirements, additional memory has no automatic economic value. Conversely, a service can be memory-constrained before compute utilization appears high. The original PagedAttention work describes how fragmentation and duplication of cache memory can limit effective serving capacity, reinforcing the need to measure the engine's allocation behavior. [15]
Adoption
For an organization already operating L40S, its own topology, utilization and maintenance records are the relevant evidence of adoption. The comparison should inventory installed devices, remaining support, server power headroom and available slots. Public system announcements cannot determine whether those particular nodes support another accelerator or whether moving workloads would require a different rack allocation.
For a larger model, two cards require an explicit serving strategy. vLLM documents both tensor and pipeline parallelism and recommends considering pipeline parallelism for GPUs without NVLink, specifically including L40S. [16] The benchmark should therefore test the supported strategies rather than assume tensor parallelism is always preferable.
Strengths and Limitations
The practical strengths of reuse are familiar configuration, available capacity and avoided replacement expenditure. Those are buyer-specific circumstances, not guaranteed properties of every installed fleet. The limitations likewise need measurement: model residency, cache exhaustion, inter-card communication and latency under burst load.
For the two-card candidate, record:
- Memory placement: weights and cache allocated on each device, including the largest per-device allocation.
- Parallelism: tensor or pipeline configuration and the reason for selecting it.
- Communication: GPU topology, host paths and measured inter-device transfer behavior.
- Operational capacity: usable throughput after failures, maintenance reserve and queueing limits.
Two L40S cards provide two separate memory allocations, not one automatically addressable 96 GB pool. A parallel runtime must distribute the work; its communication and stage balance affect the result. vLLM's topology-sensitive guidance makes that a testable system question. [16]
The procurement sequence is therefore capacity first, matched measurement second and complete system pricing third.
Feature Comparison
Table 1 establishes SKU provenance and procurement boundaries. The figures below are manufacturer specifications, not measured inference throughput.
| Candidate | Memory and bandwidth | Power and integration | Partitioning and procurement interpretation |
|---|---|---|---|
| RTX PRO 6000 Blackwell Server Edition | 96 GB GDDR7; 1,597 GB/s. [1] | Configurable up to 600 W; the Lenovo option is passive, dual-slot and PCIe Gen5. [17] | MIG profiles include 24 GB, 48 GB and 96 GB configurations; use the exact profile table and deployment prerequisites. [10] |
| One L40S | 48 GB GDDR6; 864 GB/s. [2] | 350 W maximum, passive cooling, PCIe Gen4 x16. [2] | No MIG or NVLink; a complete supported host configuration remains necessary. [2] |
| Two L40S cards | Two independent allocations; model distribution is a runtime decision. [16] | Obtain the host's supported GPU population and cooling configuration. | Benchmark the selected parallelism strategy and price the whole serving unit. |
The central distinction is per-device usable memory, followed by the supported platform. Adding published memory bandwidths across separate devices does not establish one service's attainable bandwidth or token rate. Similarly, comparing board power maxima does not reveal idle power, host consumption or facility overhead. Full-system, at-wall measurement is the appropriate performance-and-energy boundary used by MLCommons. [8]
Power limits can also change the relevant configuration. Lenovo documents a 450 W cap for a supported configuration accommodating four GPUs in its SR650a V4 platform. [17] A quote for that configuration and a benchmark at a different power limit are not a matched comparison. The cap, supported population and server model must travel with every result.
Software feature availability should receive the same scrutiny as physical compatibility. NVIDIA documents MIG as disabled by default, and recommends involving the system provider if a required video BIOS (vBIOS) update is needed. [13] Record the configuration actually accepted in the proof of concept. Procurement should treat an untested profile or kernel as an open acceptance item rather than crediting its potential benefit in the cost model.
- 96 GB GDDR7 memory and 1,597 GB/s specified bandwidth; these specifications do not establish application throughput.
- MIG can divide capacity among services, but smaller partitions reduce the memory available to each model.
- A larger per-device allocation can avoid splitting a memory-constrained model across cards if weights, cache and runtime fit with margin.
- 48 GB GDDR6 memory and 864 GB/s specified bandwidth, with neither MIG nor NVLink support.
- Additional memory has no automatic economic value when the checkpoint, cache and runtime fit and latency requirements are met.
- Two L40S cards require distributed serving; they do not form one automatically addressable memory pool.
The figures are manufacturer specifications. Procurement requires measured workload fit, supported platform configuration and complete system pricing.
Memory Capacity and Workload Fit
Weight storage is only the first term in a residency budget. A useful planning equation is:
required GPU memory = loaded weights + KV cache + runtime workspace + allocation margin
For a nominal 70 billion parameters, raw four-bit storage is 32.60 GiB; sixteen-bit storage is 130.39 GiB. A nominal 8 billion parameters requires 14.90 GiB at sixteen bits. [4] These are analyst calculations using parameters × bits / 8 / 2^30, not exact checkpoint sizes. Scales, unquantized tensors and runtime allocations must be measured. Calibration affects outputs; verify checkpoint quality. [18]
KV-cache calculation
For an unsharded, sixteen-bit cache, use:
KV bytes = 2 × layers × KV heads × head dimension × resident tokens × concurrent sequences × 2
This follows the per-layer key and value cache structure. [9]
The outer factors count keys and values and bytes per element. Each layer has separate caches. [9] Meta's original registry gives the 8B architecture 32 layers, 8 KV heads and a derived head dimension of 128; the 70B architecture has 80 layers, 8 KV heads and the same derived head dimension. [4]
These inputs yield 131,072 bytes per resident token for 8B and 327,680 bytes for 70B. An 8,192-token sequence therefore needs 1 GiB or 2.5 GiB respectively. At 32,768 tokens those become 4 GiB and 10 GiB, before block rounding or other overhead. These calculations use architectural inputs, not parameter-count scaling. [4]
Table 2 applies those calculations to explicitly hypothetical planning reserves. “Weights” includes an assumed allowance for checkpoint overhead; “runtime” is a separate reserve. Resident tokens include prompt and generated output.
| Hypothetical service | Weights / runtime reserve, GiB | Sequences × resident tokens | Calculated KV / total, GiB | Planning interpretation |
|---|---|---|---|---|
| One 8B, sixteen-bit weights | 16 / 4 | 8 × 8,192 | 8 / 28. [4] | Test on one L40S first. |
| One 70B, four-bit weights | 38 / 6 | 1 × 8,192 | 2.5 / 46.5. [4] | Borderline for a nominal 48 GB card; engine allocation decides. |
| One 70B, four-bit weights | 38 / 6 | 8 × 8,192 | 20 / 64. [4] | Candidate for one Server Edition or distributed serving. |
| Long-context 70B, four-bit weights | 38 / 6 | 4 × 32,768 | 40 / 84. [4] | Larger memory can absorb the burst only if measured overhead permits. |
| Three independent 8B four-bit services | 18 / 9 combined | 4 × 8,192 per model | 12 / 39. [4] | Consolidation may fit; scheduling and separate runtimes still need testing. |
These calculations budget simultaneous sequences at the listed lengths; validate actual capacity. [4] [9] Manufacturer GB labels must be reconciled with driver-reported allocatable bytes before comparison with these GiB budgets. Read the engine's loaded weight size, cache block count and maximum concurrency estimate; then confirm them under the workload.
Weight precision and cache precision are independent choices. Nor does a four-bit weight file establish native four-bit arithmetic: vLLM documents ModelOpt NVFP4 paths that can fall back to weight-only execution with sixteen-bit activations. [19] Retain startup logs identifying the actual kernel before attributing a result to native FP4 acceleration.
Performance and Benchmarks
A matched serving experiment
These are proposed acceptance conditions, not observed results. Use an 80% 8B / 20% 70B mix by request, and report each class separately. Pin Llama 3.1 Instruct checkpoint revisions and tokenizer templates. Meta documents prompt formatting in tokenizer configuration. [20]
Use the same supported four-bit weights with sixteen-bit activations (W4A16) checkpoint format for the primary hardware comparison after verifying both load paths. A second experiment may evaluate a Server Edition-specific four-bit floating-point (FP4) path, but it must pass the same quality evaluation. PyTorch's guidance supports checking actual outputs. [18]
The proposed workload and controls are:
- Prompts: 25% at 256 tokens, 50% at 2,048 and 25% at 6,144, sampled from representative private tasks.
- Outputs: 50% at 128 tokens, 40% at 512 and 10% at 2,048; document actual generated lengths.
- Burst: a separate 30,720-token prompt plus 2,048-token output test, without blending it into normal traffic.
- Concurrency: sweep 1, 4, 8 and 16 active requests, plus open-loop arrival-rate sweeps to expose queueing.
- Latency: proposed 95th-percentile (p95) TTFT limits of 1,000 ms for 8B and 2,000 ms for 70B.
- Decode: proposed p95 TPOT limits of 50 ms for 8B and 80 ms for 70B; also record inter-token latency.
- Reliability: proposed successful-completion threshold of 99.5%, with timeouts and retries retained in the logs.
- Quality: agree a task rubric and acceptance threshold before testing; record the evaluation set and calibration provenance. [18]
- Platform: hold host resources, software builds, power limits and request routing constant where feasible; disclose unavoidable differences.
- Cache: separate cold and production-like warm cases, control seeds and reset or vary prompts deliberately.
- Statistics: report p50, p95 and p99, repeat steady-state runs and preserve request-level timings.
- Power: measure the complete serving system during each load interval and during idle periods. [8]
- Model balance: preserve the request mix and report each model's queueing separately.
The cache control is essential: vLLM explicitly warns that repeated prompts can reuse prefix cache and inflate throughput. [21] Its benchmark client supports --goodput thresholds and selected metric percentiles; explicitly request --metric-percentiles 50,95,99 and the latency metrics required by the acceptance plan. [22] Archive the exact command rather than assuming the default percentile includes p95. TPOT is calculated per request, excluding the first token, so also retain the individual token-gap distribution. [21]
Reject configuration and arrival-rate points that miss either proposed p95 latency limit or the completion threshold before comparing procurement candidates. Quality acceptance is a separate prerequisite. Report the remaining points' request-compliant goodput, including the measured traffic mix.
What published results establish
Packet.ai publishes single-card Llama 3.1 70B Q4_K_M measurements, including 18 tokens/s at batch one and 142 tokens/s at batch 64, with reported TTFT changing from 340 ms to 1,240 ms. [6] These are attributed provider results, not this report's measurements or a matched L40S comparison. Its stated 1.79 TB/s bandwidth also differs from NVIDIA's Server Edition specification, so that hardware description should be normalized before reuse. [6] [1]
Dell's published comparison uses FP4 and eight-bit floating-point (FP8) precision, with FP4 specified only for RTX PRO 6000. [7] Such evidence can motivate a quality-controlled experiment, but cannot fill a same-checkpoint throughput cell. The procurement denominator remains measured output within both latency constraints, an approach consistent with DistServe's serving-capacity formulation. [5]
No buyer quotes or matched hardware measurements were obtained for this report. Consequently, it does not assert an actual purchase-price advantage or cost-per-token winner.
System Cost and Procurement
Quote ledger and measurement boundary
No buyer quotes or matched hardware measurements were obtained for this report. Consequently, it does not assert an actual purchase-price advantage or cost-per-token winner. Table 3 defines the quote-based three-year ledger that must be completed before a deployment decision.
| Three-year cost input | One L40S serving unit | Two-L40S serving unit | One Server Edition serving unit |
|---|---|---|---|
| Complete system acquisition | Dated quote or reuse opportunity cost | Dated matched-host quote | Dated quote, exact cooling and power option |
| Support, software and licenses | Quoted entitlement and term | Quoted entitlement and term | Quoted entitlement and term |
| Installation and migration | Estimated hours × internal rate | Include parallel-runtime validation | Include compatibility and acceptance work |
| Electricity | Metered load/idle profile × tariff. [23] | Same measurement boundary | Same measurement boundary |
| Facility or colocation | Allocated rack, power and cooling charges | Include required host footprint | Include cooling-option charges |
| Operations and resilience | Staffing allocation and spare capacity | Same service availability requirement | Same service availability requirement |
| Residual value and total | Explicit residual assumption; sum costs | Same accounting boundary | Same accounting boundary |
The ledger prevents a card price from being compared with a complete server price. It also separates a signed supplier quote from an engineering estimate. A software license should appear only when required for the chosen deployment, with support and subscription overlap checked rather than double-counted.
For energy, the U.S. Energy Information Administration's release of October 23, 2026, reports August national averages of 14.47 cents/kWh commercial and 9.64 cents/kWh industrial; its 2026 values are preliminary. [24] These provide context, not the site's marginal tariff, demand charge or contracted colocation price. Metering guidance from Natural Resources Canada recommends direct equipment energy measurement; Australian government guidance similarly calls for assessing where power is consumed. [23] (Source: www.energy.gov.au)
Data Analysis and Evidence
Facility overhead and measurement
Power usage effectiveness (PUE) is facility energy divided by information technology (IT) equipment energy. The Department of Energy and The Green Grid describe that boundary. [25] [26] Apply PUE to metered IT energy only when facility overhead is otherwise excluded. [25] Do not multiply an already inclusive colocation bill by PUE. Uptime Institute's historical survey reports weighted annual PUE of 1.54, a respondent statistic rather than a site assumption. [27]
Cost per compliant output token
Define G as SLO-compliant output tokens per second during an active service interval and u as the fraction of the evaluation horizon delivering that workload. Count only successful requests meeting request-level TTFT and TPOT limits; retain the cost of failures, retries and idle capacity. Report class-level latency distributions separately, since an aggregate token count can obscure a slower model class. [5] [22]
For an explicitly assumed horizon of three 365-day years, 26,280 hours, allocate acquisition cost evenly across the horizon and assume no discounting or residual value:
hourly cost = total three-year system cost / 26,280
cost per million compliant output tokens = hourly cost × 1,000,000 / (3,600 × u × G)
SPEC's methodology divides throughput by measured power across load intervals, including active idle; its Java workload is methodological context, not an LLM result. [28] Use the corresponding principle here: preserve the full system's idle and active costs, not merely its accelerator's rated maximum.
Hypothetical cost crossover chart
Assume three-year system totals of $30,000 for one L40S, $45,000 for two L40S and $48,000 for Server Edition. These deliberately round analyst inputs demonstrate the equation and are not market prices. They imply hourly costs of $1.142, $1.712 and $1.826 respectively. At equal occupancy and quality, divide the candidate cost by the baseline cost to obtain the required goodput ratio:
Assumed Server Edition total   vs one L40S   vs two L40S
\$36,000                       1.200         0.800
\$42,000                       1.400         0.933
\$48,000                       1.600         1.067
\$54,000                       1.800         1.200
\$60,000                       2.000         1.333
This calculation chart holds the assumed L40S totals constant. Equality is the crossover; lower cost requires exceeding the ratio. With different traffic occupancy, the condition becomes G_R / G_L > (C_R / C_L) × (u_L / u_R). A hypothetical Server Edition service delivering 200 compliant tokens/s for 40% of the horizon at the assumed cost would cost $6.34 per million compliant output tokens. Neither throughput nor occupancy is a measured result.
Implications and Future Directions
The larger-memory option deserves testing when model residency or cache growth forces an additional serving device. It also deserves testing when multiple small services can share capacity without sacrificing their individual latency or quality requirements. Hardware partitioning may support that arrangement, but the application still needs its own scheduling and admission controls.
The engineering decision should be recorded as a short acceptance package:
- Retain: keep the installed L40S service when its measured memory margin, goodput and forward cost meet requirements.
- Expand: quote additional L40S capacity when independent replicas handle the workload economically.
- Distribute: test two L40S cards when a model needs sharding, reporting per-device allocation and parallel-runtime overhead.
- Consolidate: test Server Edition where its larger allocation can remove a device or accommodate measured context bursts.
- Reprice: rerun the crossover with actual support, software, facility, migration and residual assumptions.
- Revalidate: repeat acceptance when changing checkpoint, quantization, kernel, partition profile or power limit.
The matched comparison should then receive a sensitivity analysis. Vary the negotiated system-cost spread, active traffic fraction, electricity tariff and model mix independently. Keep quality gates fixed. A hardware-specific low-precision path belongs in a separate scenario until its output quality is accepted; vLLM's documented fallback behavior makes kernel provenance part of that record. [19]
Energy management deserves attention alongside utilization. ENERGY STAR describes efficiency in both active and idle states and emphasizes keeping power-management settings engaged. [29] Australian guidance recommends understanding system energy flows, while Canada's metering guidance supports measuring equipment directly. (Source: www.energy.gov.au) [23] These practices help distinguish an accelerator improvement from a host or facility change.
For GPU Smith's adjacent advisory perspective, the defensible recommendation is a reproducible acceptance threshold rather than a generic specification winner. A future quote or software release can move the threshold in either direction. Keeping source dates, configuration logs and request traces with the analysis allows that change to be evaluated without turning an old vendor benchmark into a permanent procurement rule.
Conclusion
- 01Establish actual capacity
Read loaded weight size, cache block count and maximum concurrency from the engine, then confirm them under the workload.
- 02Measure matched service
Require quality acceptance and compare request-compliant goodput only at points meeting the proposed latency and completion limits.
- 03Price the complete system
Complete the quote ledger with consistent system boundaries, separating supplier quotes from engineering estimates.
- 04Apply the crossover threshold
Compare goodput ratios with fully loaded cost ratios at equal occupancy, quality and service requirements.
Server Edition lowers cost when its measured goodput ratio exceeds its fully loaded cost ratio under the same occupancy, quality and service requirements.
RTX PRO 6000 Server Edition can change the economics of private inference when its per-device memory removes a concrete workload constraint. The relevant constraints include weight residency, concurrent KV cache, multiple model reservations and long-context bursts. The comparison must also include the supported server, cooling option, software configuration and the cost of moving the service.
An existing L40S deployment can remain the economical choice when its models fit and its measured service meets the required latency and quality. A pair of L40S cards is a distinct distributed-serving candidate, with its own memory placement and communication behavior. Neither reuse nor replacement should be selected from aggregate memory or peak arithmetic specifications alone.
The procurement sequence is therefore capacity first, matched measurement second and complete system pricing third. Establish actual loaded memory, pin the checkpoint and execution path, measure request-level compliance across representative traffic, and populate the dated quote ledger. Evaluate smaller-model and larger-model services separately before aggregating their output.
Finally, compare goodput ratios with fully loaded cost ratios at the same occupancy, quality and service requirements. The hypothetical crossover calculations show how to make that comparison; they do not supply missing quotes or hardware results. Until those inputs are available, the defensible output is a testable deployment shortlist and an explicit decision threshold. Once they are available, the same worksheet supports a specific retain, expand or replace decision without relying on an advertised performance multiplier.
External Sources (29)
About
GPUSmith
Plan and build private AI compute with GPU Smith. We connect workload requirements with GPU hardware, networking, deployment and operating decisions so your infrastructure fits the work it must perform.
GPU Smith provides independent engineering and research for private AI infrastructure. We help technical buyers and operators reason about GPU workload sizing, hardware selection, procurement, deployment and inference operations, from the compute system to the networking, power and cooling requirements around it.
Start with the workload
Useful infrastructure decisions begin with the models, data, throughput, latency and operating constraints a team actually has. GPU Smith helps connect those requirements with system design and deployment choices. The goal is a privately controlled AI environment whose capacity and operational demands are understood before a purchasing decision.
Hardware and supplier research
Our public reference library covers GPUs, complete systems and networking components. The server-vendor directory and manufacturing research help teams investigate suppliers, compare options and follow sources behind technical claims. We distinguish manufacturer specifications from measured benchmarks and advertised capabilities from tested configurations. Reference pages are research resources, not a live inventory listing or a binding equipment quote.
Deployment and operations
GPU Smith's engineering scope includes infrastructure integration, networking, power, cooling and the practical operation of inference workloads. Our published articles explain the tradeoffs behind deployment, procurement and ongoing operations so teams can ask better questions and document decisions.
Work with GPU Smith
Explore the hardware library, GPU references, networking references and vendor research. Contact GPU Smith with your workloads and deployment constraints to discuss a project and confirm current scope, pricing and availability.
Inclusion of a manufacturer or product in our research does not imply a partnership, certification or endorsement.
Disclaimer
This document is provided for informational purposes only. No representations or warranties are made regarding the accuracy, completeness, or reliability of its contents. Any use of this information is at your own risk. GPUSmith shall not be liable for any damages arising from the use of this document. This content was generated with assistance from artificial intelligence tools, which may contain errors or inaccuracies. Readers should verify critical information independently. All product names, trademarks, and registered trademarks mentioned are property of their respective owners and are used for identification purposes only. Use of these names does not imply endorsement. This document does not constitute professional or legal advice. For specific guidance related to your needs, please consult qualified professionals.