GPUSmith Article
GPU Power Smoothing for AI Training Load Swings
Why synchronous AI training makes megawatt load swings, how GB200/GB300 power smoothing, PSU storage, UPS and BESS damp them, and what NERC now asks.
Summary
- 01Synchronous training aligns GPU compute and communication phases, creating repeated facility power swings whose amplitude grows with the job.
- 02Smoothing combines GPU power floors and ramp limits, rack storage for fast edges, and facility storage plus utility coordination for slower changes.
- 03In the assumed cluster example, a GPU power floor sharply reduces the load swing but raises energy use. The result depends on duty cycle and trough depth.
- 04Rack capacitors clip fast edges; facility storage must also meet power, response-time and micro-cycling requirements. A UPS needs suitable controls to smooth input power.
- 05Measure the real waveform, obtain the utility specification in writing, then select the lowest floor and fastest ramps that meet it.
Inside this article
- 01Why synchronous training makes a spiky load
- 02Scale effects and utility frequencies
- 03Worked example: a 9,216-GPU cluster (assumption-based scenario)
- 04Three layers of mitigation
- 05GB300 NVL72 power smoothing
- 06Where UPS and batteries fit
- 07Generator and transfer considerations
- 08What utilities and NERC are asking
- 09Measuring your own load profile
- 10Design and procurement checklist
- 11Cost and trade-offs
Why synchronous training makes a spiky load
A large training job draws power in a square-ish wave: every GPU computes, then every GPU waits on the same collective, then computes again. With tens of thousands of GPUs in lockstep, the facility sees one load swinging between near-peak and much lower, many times a minute, for weeks. The fix is a stack, not one device: GPU firmware that sets a power floor and ramp limits, rack energy storage for the fastest edges, and facility storage plus utility coordination for the slow ones.
A 2025 paper by Microsoft, OpenAI and NVIDIA engineers describes the mechanism: during every iteration "there is a computation-heavy phase, where each GPU works on the local data, and a communication-heavy phase where all the GPUs synchronize on the data", and because compute phases need far more power, "large power swings occur" [1]. Compute draws close to TDP; communication can fall close to idle. The swings repeat from about once per second to once every tens of seconds depending on job scale; at scale "these swings can amount to tens or hundreds of megawatts" [1].
Google observed "power fluctuations in the tens of megawatts (MW)" on batch-synchronous ML workloads, attributed to "alternating compute- and networking-intensive phases of the workload within a training step" [2]. NERC's large-loads white paper shows a 50 MW block of a 200 MW AI training site where, in the fastest ramp, demand changed "at a rate of 1.9 p.u. per second for about 250 milliseconds" [3]. At rack level, NVIDIA says a rack "can swing from an 'idle' state of around 30% to 100% utilization and back again in milliseconds" [4].
Scale effects and utility frequencies
Amplitude scales with the job. Because every GPU in the job moves together, the swing grows "proportionally with the number of GPUs participating in the job and their peak per-GPU power" [1].
The frequency lands where the grid has modes. The paper's FFT of a production H100 trace shows energy "concentrated between 0.2–3 Hz", close to known resonant modes of turbine-generator shafts and long transmission lines [1]. NERC's data center modeling reference puts the risk in two bands: the electromechanical inter-area range of 0.2 to 2.5 Hz and the subsynchronous torsional range of roughly 5 to 50 Hz [5]. On the torsional band it is blunt: "it is best just to stay entirely clear of any continuing cyclical injections within this range, especially if there are synchronous generating plants nearby."
NERC cites precedents: a 2019 Florida steam unit that produced a 200 MW forced oscillation at 0.25 Hz, matching an Eastern Interconnection inter-area mode, and a 2023 Midwest data center whose power electronics perturbed the system once per second, each time causing an 11 Hz ringdown [3]. The training-cluster concern is that the synchronous portion of a large job "can be much greater" than the 200 MW Florida source [1].
Worked example: a 9,216-GPU cluster (assumption-based scenario)
Every input below is an assumption chosen to make the arithmetic visible, not a datasheet value. NVIDIA publishes no per-GPU power for GB200 or GB300 NVL72; we picked 1,250 W so the rack peak lands on the "approximately 120kW" NVIDIA gives for a DGX GB200 rack [6]. Your own trace will differ.
| Parameter | Assumed value |
|---|---|
| Racks | 128 NVL72-class racks x 72 GPUs = 9,216 GPUs |
| GPU module power, compute phase | 1,250 W, our assumption (72 x 1,250 W = 90 kW per rack) |
| Rest of rack (CPUs, NICs, switches, fans, losses) | 30 kW per rack, treated as constant |
| GPU module power, communication phase | 20% of 1,250 W = 250 W |
| Iteration | 2.0 s: 1.5 s compute, 0.5 s communication |
| Edge duration | 100 ms per transition |
Step 1: rack swing. Peak = 90 + 30 = 120 kW. Trough = (72 x 0.25) + 30 = 48 kW, 40% of peak, near NVIDIA's "around 30%" idle figure. Swing = 120 - 48 = 72 kW per rack.
Step 2: cluster swing. 128 x 72 kW = 9.216 MW peak-to-trough. Peak = 128 x 120 kW = 15.36 MW; trough = 6.144 MW; average = 0.75 x 15.36 + 0.25 x 6.144 = 13.056 MW.
Step 3: ramp rate. 9.216 MW in 100 ms = 92.2 MW/s, about 5,530 MW/min. NERC's 2026 alert asks planners to collect each computational load's "expected maximum ramp rate (MW/min)" [7]; NVIDIA notes that generation can take "one minute to 90 minutes" to respond to a sudden ramp [8].
Step 4: frequency. A 2.0 s period is a 0.5 Hz fundamental, with harmonics at 1.0 and 1.5 Hz for a 75% duty cycle. All sit inside NERC's 0.2 to 2.5 Hz inter-area band.
Step 5: a GPU power floor. The paper reports a maximum minimum power floor (MPF) of 90% of TDP on GB200 [1]. At 90% of 1,250 W = 1,125 W, rack trough = 81 + 30 = 111 kW, swing = 9 kW per rack, cluster swing = 1.152 MW (87.5% lower). The floor adds 63 kW per rack for 25% of each iteration: 15.75 kW average per rack, 2.016 MW for the cluster, or 2.016 / 13.056 = 15.4% more energy. The paper's simulation at a 90% floor on a real trace found 10.5% [1]; the gap shows how much the answer depends on duty cycle and trough depth.
Step 6: rack energy storage. GB300 NVL72 power shelves carry "65 joules/GPU of energy storage" [8]: 72 x 65 J = 4,680 J per rack. That covers the full 72 kW swing for 4,680 / 72,000 = 0.065 s, assuming all of it is usable (NVIDIA does not publish the usable fraction). Flattening the iteration to its 102 kW average needs 18 kW x 1.5 s = 27 kJ per rack per cycle, 5.8 times the stored energy. Capacitors clip fast edges; they cannot erase a two-second cycle.
Step 7: facility BESS. Flattening the cluster at the facility needs 128 x 27 kJ = 3.456 MJ (under 1 kWh) per cycle, but about 9.2 MW of power rating and 86,400 / 2 = 43,200 shallow reversals a day. For a BESS or UPS vendor the question is power, response time and cycle life under micro-cycling, not energy. This is engineering analysis, not a vendor rating.
Step 8: utility ramp limit to nvidia-smi units. Suppose the utility caps start-up ramps at 10 MW/min (hypothetical). The 9.216 MW step takes 0.92 min, about 55 s. 10,000 kW / 60 s = 166.7 kW/s, or 18.1 W/s per GPU across 9,216 GPUs, which nvidia-smi expresses as about 18,100 mW/s. A crash with the burner tapering at the same rate wastes 0.5 x 9.216 MW x 55.3 s = 255 MJ, about 71 kWh per event.
- Rack power falls from 120 kW to 48 kW, a 72 kW swing.
- Across the cluster, the peak-to-trough swing is 9.216 MW.
- Rack trough rises to 111 kW; the cluster swing falls to 1.152 MW, 87.5% lower.
- Average cluster power increases by 2.016 MW, using 15.4% more energy.
Every input in the worked example is an assumption, not a datasheet value. The energy penalty depends on duty cycle and trough depth.
Three layers of mitigation
The paper evaluates three classes of fix and rates them across reliability, performance, energy, cost, ability to meet the tightest spec and lifetime [1].
| Layer | How it works | Main cost | Limit |
|---|---|---|---|
| Software (Microsoft's "Firefly") | Inject a secondary GEMM workload via MPS when GPU activity drops | Wasted energy, host overhead for 1 ms telemetry; under 5% primary-job overhead reported | Shared failure domain under MPS; needs tenant cooperation in VMs |
| GPU firmware power smoothing | Programmed ramp-up/ramp-down rates (W/s), minimum power floor, stop delay | Burned energy; hardware lifetime counter | GB200 floor capped at 90% of TDP and EDP at minimum 1.1x TDP, leaving at least 20% of TDP as dynamic range |
| Rack energy storage | Charge in communication phases, discharge in compute phases | Capex, rack space, embodied carbon | Ramp-up and ramp-down edges need very large capacitance |
The paper recommends combining GPU-level smoothing (for ramp specs and when storage runs out) with rack-level storage that shares state of charge. It adds a "fast telemetry-based backstop" that escalates from throttling to load shedding if a critical frequency appears, and suggests long-duration BESS for larger deployments [1]. Google reports a compiler-level variant on TPUs that cut fluctuation magnitude "by nearly 50%" with "<1% performance impact" [2].
Measure the real waveform, get the utility's spec in writing, then pick the lowest floor and fastest ramps that meet it rather than defaulting to maximum smoothing.
GB300 NVL72 power smoothing
NVIDIA's July 2025 description of GB300 NVL72 has three parts [8]:
- Power cap on ramp-up. At workload start, "new maximum power levels are sent to the GPUs and gradually increased, aligning with the ramp rates the grid can tolerate."
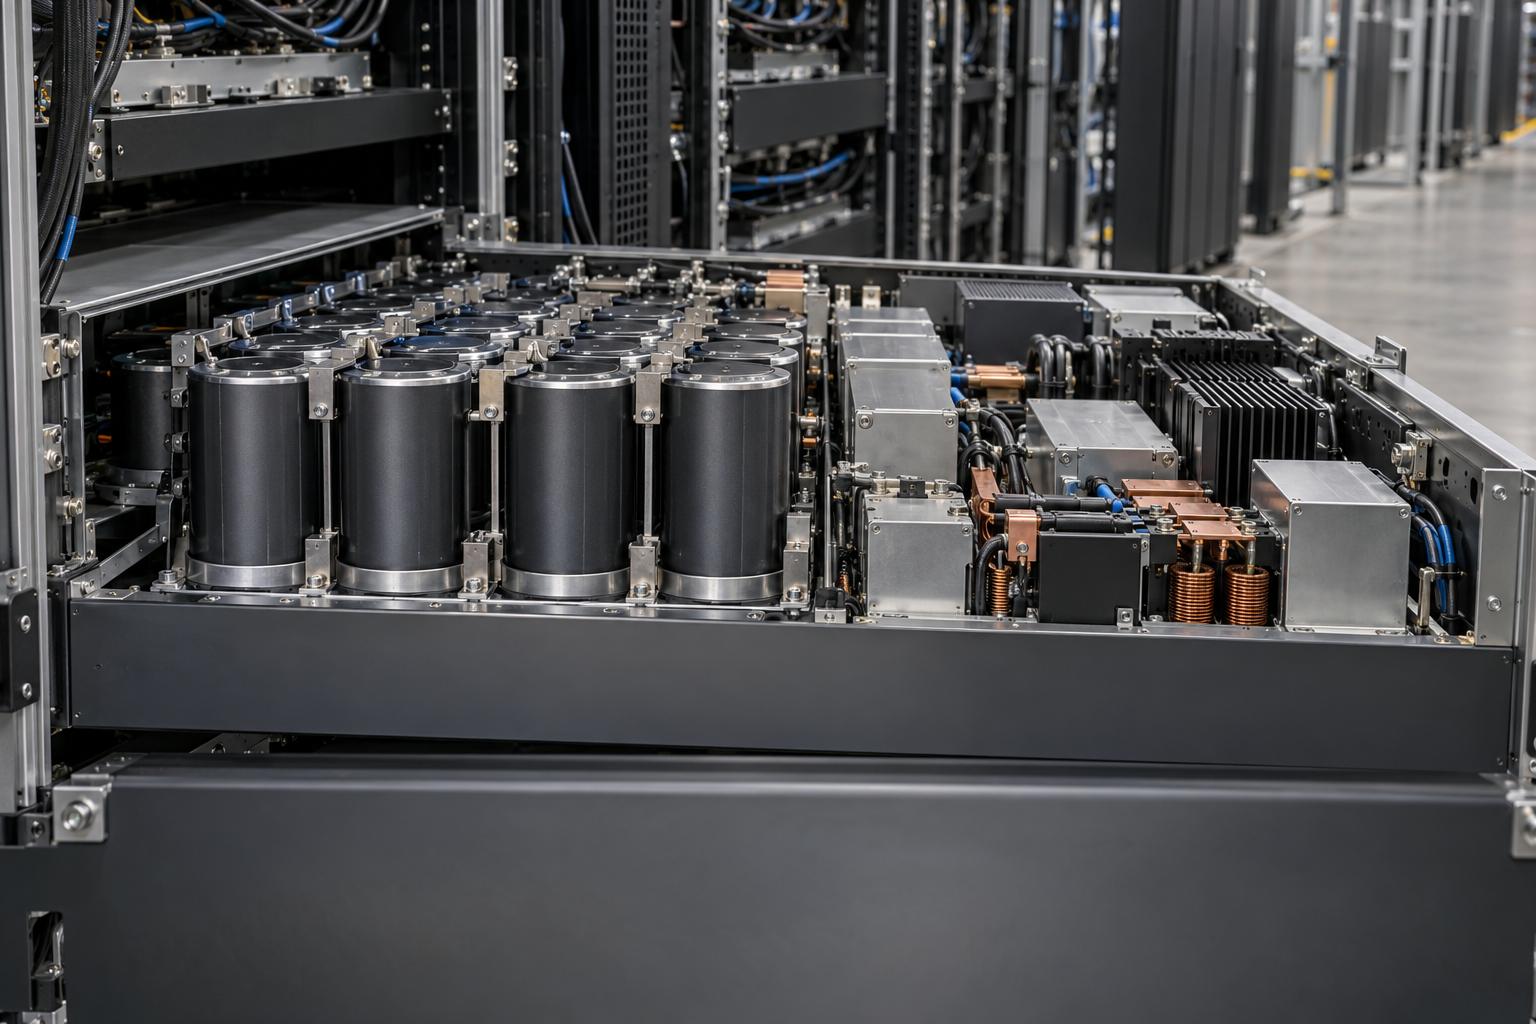
- Energy storage in the PSUs. In the redesigned power shelf, "about half of the volume is occupied by capacitors for energy storage", 65 J per GPU, with "a new charge management controller." NVIDIA reports that "the peak power demand seen by the grid is reduced by 30% when training the Megatron LLM" (the intro says "up to 30%"), measured against a GB200 PSU on the same rack and workload. That is a vendor measurement on one workload.
- Power burner on ramp-down. If the workload stops abruptly, "the GPU burn system continues to dissipate power by operating the GPU in a special power burner mode", tapers "at a rate consistent with grid capabilities", and disengages instantly if work resumes.
The storage "does not provide energy back to the utility". The named tunables include GPU-active floor power, GPU-idle floor power, idle time before ramp-down and ramp-down rate, settable "using the NVIDIA SMI tool or the Redfish protocol". The post says the feature is "also coming to GB200 NVL72" but names only GB300 NVL72 for the energy-storage PSU, and the paper shows floor and ramp controls already on GB200 hardware. NVIDIA's GB300 NVL72 page reads "Available Now" (checked 2026-10-28). Confirm with your OEM what your SKU and firmware ship.
The nvidia-smi controls
In the current driver documentation, nvidia-smi power-smoothing manages preset profiles. Per profile you set --percent-tmp-floor (a percentage of the Total Module Power ceiling, within the GPU's min/max floor range), --ramp-up-rate and --ramp-down-rate (in mW/s), and --ramp-down-hysteresis (in ms); -spp activates a profile, -s enables or disables the feature, and -ppd prints profile definitions. Setting values requires root [9]. Queries expose "HW Lifetime % Remaining" because "the circuitry which drives the feature wears down", and newer driver branches add "Delayed Power Smoothing" (primary and secondary floors) and a "State-Of-Charge Power Smoothing" field. Watch the units: the nvidia-smi page and NVML's field IDs state ramp rates in mW/s, while the NVML header comment for nvmlDevicePowerSmoothingSetProfileParam says W/s (nvml.h in NVIDIA go-nvml, read 2026-10-28). Set a value, read it back, and check what your driver branch supports before automating.
- 01Cap power on ramp-up
At workload start, gradually increase GPU maximum power levels to align with the ramp rates the grid can tolerate.
- 02Use power-shelf energy storage
Capacitors and a charge management controller provide energy storage in the redesigned power shelf.
- 03Taper power on ramp-down
After an abrupt stop, the GPU burner dissipates power and tapers it at a grid-compatible rate; it disengages instantly if work resumes.
Where UPS and batteries fit
NVIDIA's 800 VDC architecture describes "short-duration storage (milliseconds to seconds)", capacitors and supercapacitors close to the racks, and "long-duration storage (seconds to minutes)", facility BESS at the utility interconnection that handles "the ramp-up and ramp-down of entire workloads" and provides "ride-through capability during transfers to backup generators" [4]. See our 800 VDC power explainer for the distribution side.
- Many AI halls have no IT UPS. NERC notes that industry experts say AI data center power delivery "commonly exclude[s] UPS protection systems for the IT equipment", relying on checkpoints instead [3].
- UPS mode changes what the grid sees. NERC's Level 3 alert asks planners to collect "uninterruptable power supply (UPS) settings and configurations" as part of a facility's dynamic characteristics [7], and the modeling reference describes different fault behavior in normal, eco and battery modes [5].
- A UPS is not automatically a smoother (our engineering judgment). Unless its rectifier and battery controls are designed to hold input power steady, a double-conversion UPS passes load changes upstream; ask the vendor at what bandwidth and cycle count it can. NERC says BESS and storage-equipped STATCOMs "can, in theory, smooth out variations by alternately charging and discharging, but may not remove them entirely" [5].
Our data center electrical design guide covers steady-state UPS sizing and redundancy; this article deliberately does not.
- Capacitors and supercapacitors sit close to the racks for short-duration storage.
- In the assumed example, capacitors clip fast edges but cannot erase the two-second cycle.
- Storage at the utility interconnection handles whole-workload ramps and supports transfers to backup generators.
- Sizing must address power, response time and cycle life under micro-cycling.
A UPS is not automatically a smoother. Its rectifier and battery controls must be designed to hold input power steady.
Generator and transfer considerations
This section raises design questions; we did not find public generator-OEM data on cyclic training loads. Kohler's summary of ISO 8528-5:2022 gives G3 limits of "±7% / ±10% for diesel" frequency deviation, "-15% / +20%" voltage deviation, and recovery within 3 s (frequency) and 4 s (voltage), with load acceptance tested as increasing BMEP-based steps and rejection as a single 100% step [10].
A site on generator in the worked example would see a roughly 9 MW step every second or two, repeatedly, not one acceptance step. Ask:
- Can the gensets and governors tolerate sustained cyclic load at the iteration frequency? Is there test or simulation data?
- Should a more conservative smoothing profile (higher floor, slower ramps) activate automatically on transfer?
- What happens to the job, and to the burner, during the transfer window itself?
Transfers also matter to the grid: NERC attributes an approximately 1,500 MW load reduction in the Eastern Interconnection primarily to data centers and other power electronic loads transferring to backup generation [3].
What utilities and NERC are asking
NERC issued a Level 3 Essential Action on computational loads with initial distribution on May 4, 2026, acknowledgement by May 11 and reporting "by Midnight Eastern on August 3, 2026" [7]. It is addressed to planners, transmission owners and operators, not data center owners, and "does not create a mandatory obligation", but its requests reach you through interconnection requirements. Registration is coming separately. The alert's draft "Computational Load Entity" (20 MW, 60 kV) was replaced in NERC's August 19, 2026 Rules of Procedure posting by two entity types, Computational Load Owner and Operator, for sites with "total connected Load greater than or equal to 50 MW" connected at 100 kV or above [11]. FERC directed NERC to file registry criteria and initial standards by December 31, 2026; as of October 28, 2026 the criteria are proposed, not approved.
What the alert asks utilities to collect or require, as of October 2026:
- A PERC1 model (or equivalent) of the facility, with IT and non-IT load modeled separately.
- Expected MW minimum and maximum, power factor, and expected maximum up- and down-ramp in MW/min.
- Protection settings, reconnection behavior, on-site generation and BESS behavior, and the facility's use (AI training is listed explicitly).
- Commissioning tests (full-load, no-load, 10% voltage change), better facility "ride-through", and continuous plus triggered disturbance recording.
The modeling reference adds a study method for "slow forced oscillations emanating from AI training": play back a measured or synthetic training profile into a phasor-domain load model, limited to lower frequencies ("typically less than 5Hz") because positive-sequence tools do not model generator torsional modes [5]. Expect your utility to ask for a representative training trace. Commercial curtailment is covered in our demand response and interconnection plan.
Measuring your own load profile
You cannot negotiate a spec without a trace:
| Source | What it resolves | Caveat |
|---|---|---|
| NVIDIA in-band GPU counters | Per-GPU power and activity | Latency of 1 to 100 ms depending on counter reliability; reliable 100 ms counters are too slow to act on 20 Hz content [1] |
| PMUs at the point of interconnection | Inter-area oscillations below about 1 Hz | Typically 30 or 60 reports/s; accuracy mandated only up to 2 Hz (P-class) or 5 Hz (M-class); "limited use" above 10 Hz [5] |
| Point-on-wave recorders | Subsynchronous content and fast edges | Data volume; usually trigger-based |
To stress the electrical path first, DCGM's Pulse test (level 4) is "meant to fluctuate the power usage to create spikes in current flow on the board", with work "synchronized to create extra stress on the power supply"; the Targeted Power test (level 3 and higher) instead sustains power near TDP and "does not pulse" [12]. Neither reproduces a facility-scale waveform; record the first production runs at the meter with smoothing on and off.
Design and procurement checklist
GPU and rack OEM
- Which power smoothing features ship on this SKU and firmware: floor, ramp rates, hysteresis, burner, PSU energy storage, state-of-charge smoothing?
- Floor range (min/max % TMP), ramp-rate range and units, and the hardware lifetime budget for the feature.
- Measured rack-input waveforms for a named training workload with smoothing off and on.
- Redfish exposure so facility controls can switch profiles.
UPS and BESS vendor
- Can the system hold input power steady against a cyclic load at 0.2 to 3 Hz? At what power and with what cycle-life impact?
- Behavior in eco, double-conversion and battery modes during a swing, and during a grid fault.
- Ride-through support during generator transfer.
Utility
- Time-domain spec: ramp-up and ramp-down limits and allowed dynamic range.
- Frequency-domain spec: critical bands and allowed magnitude. The paper's illustrative example is a 0.1 to 20 Hz band with spectral magnitude capped at 20% of total harmonic energy [1]; yours may differ.
- Required model (PERC1 or EMT), required trace format, and recording equipment at the point of interconnection.
Cost and trade-offs
The trade-off is energy and time against grid access. A floor burns energy in every communication phase (15.4% in the assumed example, 10.5% in the paper's simulation); conservative ramps delay every job start, and the burner wastes energy at every stop. Rack storage avoids most of the burn but covers only short events; facility BESS covers job-level ramps but must survive heavy micro-cycling.
Where interconnection is the binding constraint, several percent extra energy for an acceptable load profile can be the cheaper path; our GPU power cap economics article covers the related trade for inference. Measure the real waveform, get the utility's spec in writing, then pick the lowest floor and fastest ramps that meet it rather than defaulting to maximum smoothing.
GPU Smith helps teams model training load profiles and specify power smoothing with OEMs and utilities; contact us.
External Sources (12)
About
GPUSmith
Plan and build private AI compute with GPU Smith. We connect workload requirements with GPU hardware, networking, deployment and operating decisions so your infrastructure fits the work it must perform.
GPU Smith provides independent engineering and research for private AI infrastructure. We help technical buyers and operators reason about GPU workload sizing, hardware selection, procurement, deployment and inference operations, from the compute system to the networking, power and cooling requirements around it.
Start with the workload
Useful infrastructure decisions begin with the models, data, throughput, latency and operating constraints a team actually has. GPU Smith helps connect those requirements with system design and deployment choices. The goal is a privately controlled AI environment whose capacity and operational demands are understood before a purchasing decision.
Hardware and supplier research
Our public reference library covers GPUs, complete systems and networking components. The server-vendor directory and manufacturing research help teams investigate suppliers, compare options and follow sources behind technical claims. We distinguish manufacturer specifications from measured benchmarks and advertised capabilities from tested configurations. Reference pages are research resources, not a live inventory listing or a binding equipment quote.
Deployment and operations
GPU Smith's engineering scope includes infrastructure integration, networking, power, cooling and the practical operation of inference workloads. Our published articles explain the tradeoffs behind deployment, procurement and ongoing operations so teams can ask better questions and document decisions.
Work with GPU Smith
Explore the hardware library, GPU references, networking references and vendor research. Contact GPU Smith with your workloads and deployment constraints to discuss a project and confirm current scope, pricing and availability.
Inclusion of a manufacturer or product in our research does not imply a partnership, certification or endorsement.
Disclaimer
This document is provided for informational purposes only. No representations or warranties are made regarding the accuracy, completeness, or reliability of its contents. Any use of this information is at your own risk. GPUSmith shall not be liable for any damages arising from the use of this document. This content was generated with assistance from artificial intelligence tools, which may contain errors or inaccuracies. Readers should verify critical information independently. All product names, trademarks, and registered trademarks mentioned are property of their respective owners and are used for identification purposes only. Use of these names does not imply endorsement. This document does not constitute professional or legal advice. For specific guidance related to your needs, please consult qualified professionals.